Motivation and Concept
APM (Application Performance Monitoring) tools like Datadog are important for our system because they provide valuable insights into the performance, behavior, and security of our applications. They allow us to identify performance issues in real-time, improve application performance, troubleshoot problems, plan capacity, and identify security vulnerabilities.
The performance tracing implementation is done by:
- Running an agent beside your service(s). One agent could be used by several services. The agent acts as gateway to send data to Datadog APIs.
- Inject the tracer inside your app.
- For monitoring a casual HTTP service, by default the tracer will watch each request that comes to the router.
- For deep performance monitoring, custom instrumentation is possible, deep down to SQL queries.
- Inter-service performance monitoring is also possible, see Distributed Tracing below.
The yellow-colored parts are the ones that you need to setup,

Examples
First, get your DATADOG _API_KEY then run the agent,
docker run -d --cgroupns host \
              --pid host \
              -v /var/run/docker.sock:/var/run/docker.sock:ro \
              -v /proc/:/host/proc/:ro \
              -v /sys/fs/cgroup/:/host/sys/fs/cgroup:ro \
              -p 127.0.0.1:8126:8126/tcp \
              -e DD_API_KEY=<DATADOG_API_KEY> \
              -e DD_APM_ENABLED=true \
              gcr.io/datadoghq/agent:latest
This is the basic example of ddtrace implementation for go-chi,
package main

import (
        "net/http"
        "github.com/go-chi/chi/v5"
        "github.com/go-chi/chi/v5/middleware"
        ddchi "gopkg.in/DataDog/dd-trace-go.v1/contrib/go-chi/chi.v5"
        "gopkg.in/DataDog/dd-trace-go.v1/ddtrace/tracer"
)

func welcome(w http.ResponseWriter, r *http.Request) {
        w.Write([]byte("Hello world!"))
}

func main() {
        tracer.Start() // Start the tracer daemon
        r := chi.NewRouter()
        r.Use(ddchi.Middleware()) // Inject the tracer
        r.Use(middleware.Logger)
        r.Get("/hello", welcome)
        http.ListenAndServe(":8000", r)
}
Then run the service by pointing out the agent through DD_AGENT_HOST envar,
$ DD_AGENT_HOST=localhost go run single/main.go
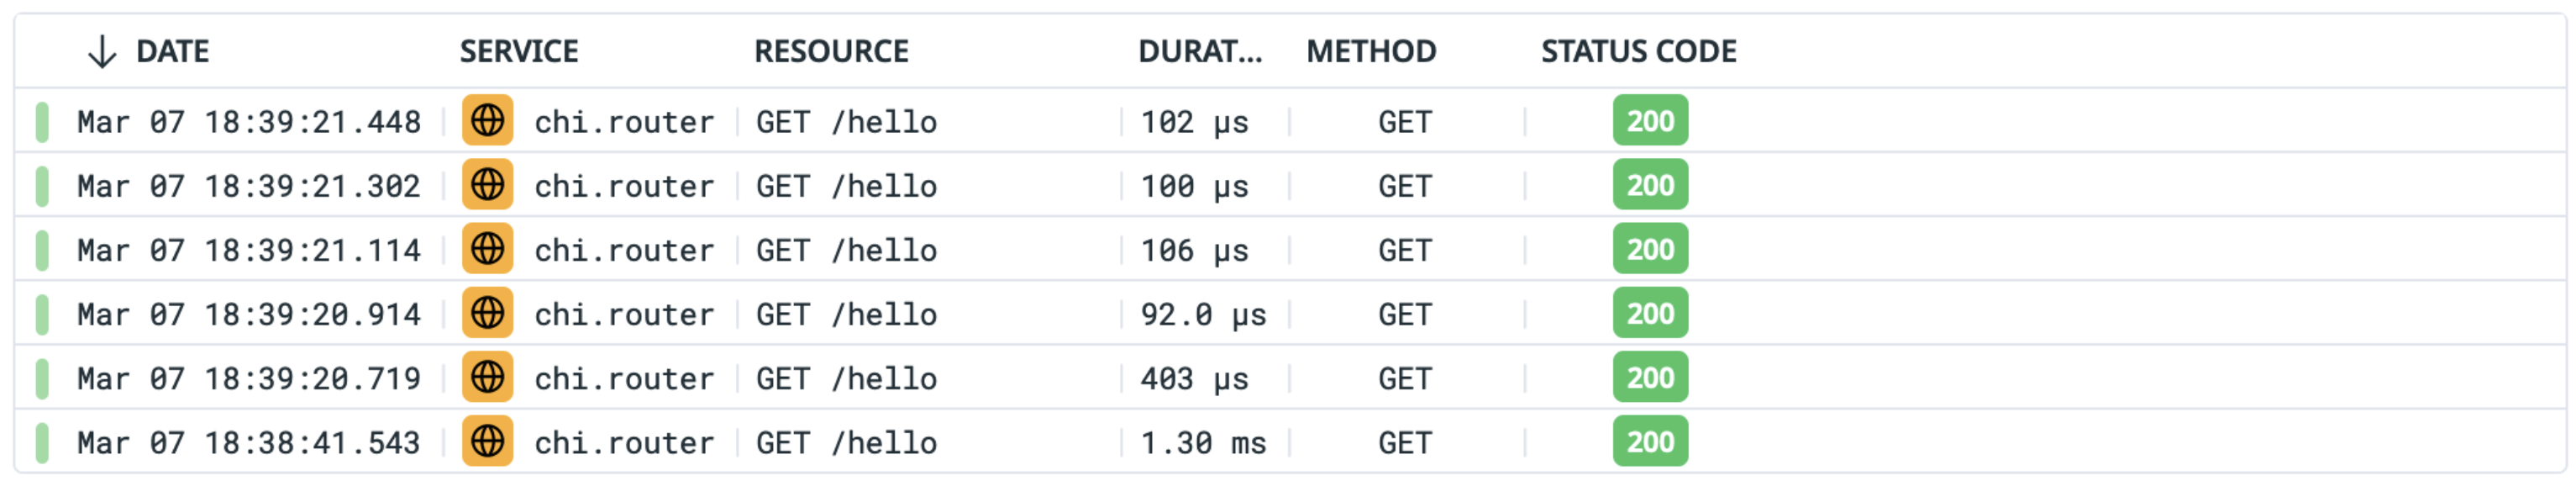
If you try to hit http://localhost:8000/hello several times, the traced data will be shown in Datadog APM dashboard.
Custom Instrument
Custom instruments allow us to get deep insight into the performance of our service. Imagine the /hello endpoint has to call another function like this
func functionA() {
        time.Sleep(60 * time.Millisecond)
        return
}

func welcome(w http.ResponseWriter, r *http.Request) {
        time.Sleep(10 * time.Millisecond)
        functionA()
        time.Sleep(10 * time.Millisecond)
        w.Write([]byte("Hello world!"))
}
I did intentionally put some delays to simulate bottlenecked situations.
Nested flamegraph
At the code below I put tracer.StartSpanFromContext at the start of the function. You can see r.Context() is passed to another function. This context contains important tracing metadata like process-id and runtime-id that helped Datadog to build visual flamegraph of your performance profiling later.
func functionA(ctx context.Context) {
        span, _ := tracer.StartSpanFromContext(ctx, "functionA", tracer.ResourceName("someParam"))
        defer span.Finish()
        time.Sleep(60 * time.Millisecond)
        return
}

func welcome(w http.ResponseWriter, r *http.Request) {
        time.Sleep(10 * time.Millisecond)
        functionA(r.Context())
        time.Sleep(10 * time.Millisecond)
        w.Write([]byte("Hello world!"))
}
If you try to hit the endpoint, you’ll see the functionA() bottlenecked our /hello endpoint:
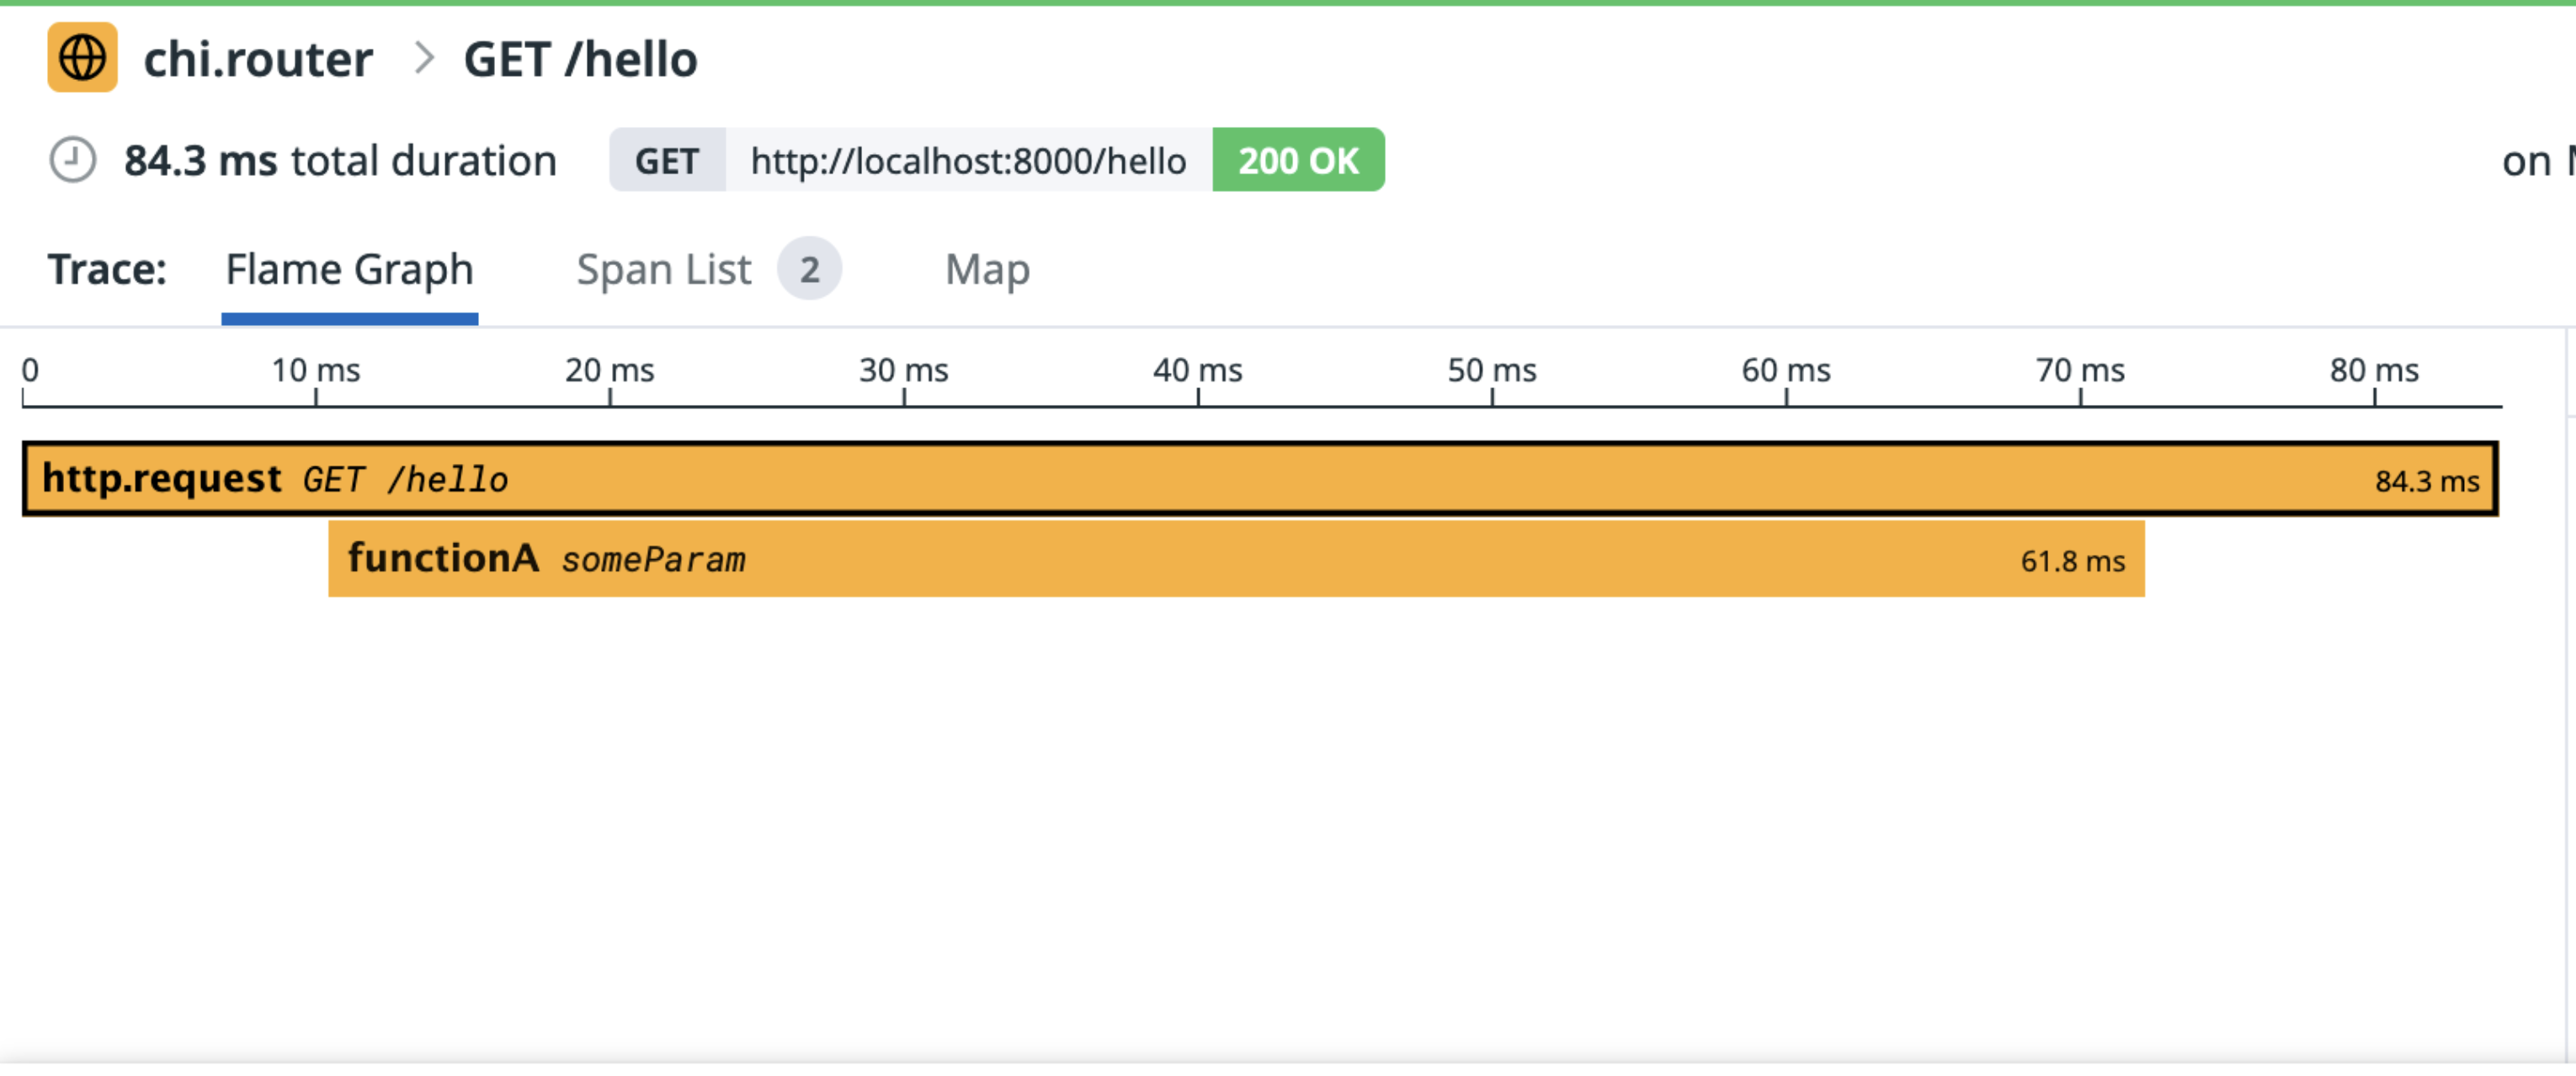
Synchronous execution
The sibling process in flamegraph is also possible, assuming that functionA() and functionB() are executed in sync and functionC() is nested under functionB(), consider this example code,
func functionA(ctx context.Context) {
        span, _ := tracer.StartSpanFromContext(ctx, "functionA", tracer.ResourceName("someParam"))
        defer span.Finish()
        time.Sleep(60 * time.Millisecond)
        return
}

func functionB(ctx context.Context) {
        span, ctx := tracer.StartSpanFromContext(ctx, "functionA", tracer.ResourceName("someParam"))
        defer span.Finish()
        time.Sleep(10 * time.Millisecond)
        functionC(ctx)
        return
}

func functionC(ctx context.Context) {
        span, _ := tracer.StartSpanFromContext(ctx, "functionA", tracer.ResourceName("someParam"))
        defer span.Finish()
        time.Sleep(60 * time.Millisecond)
        return
}

func welcome(w http.ResponseWriter, r *http.Request) {
        time.Sleep(10 * time.Millisecond)
        functionA(r.Context())
        functionB(r.Context())
        time.Sleep(10 * time.Millisecond)
        w.Write([]byte("Hello world!"))
}
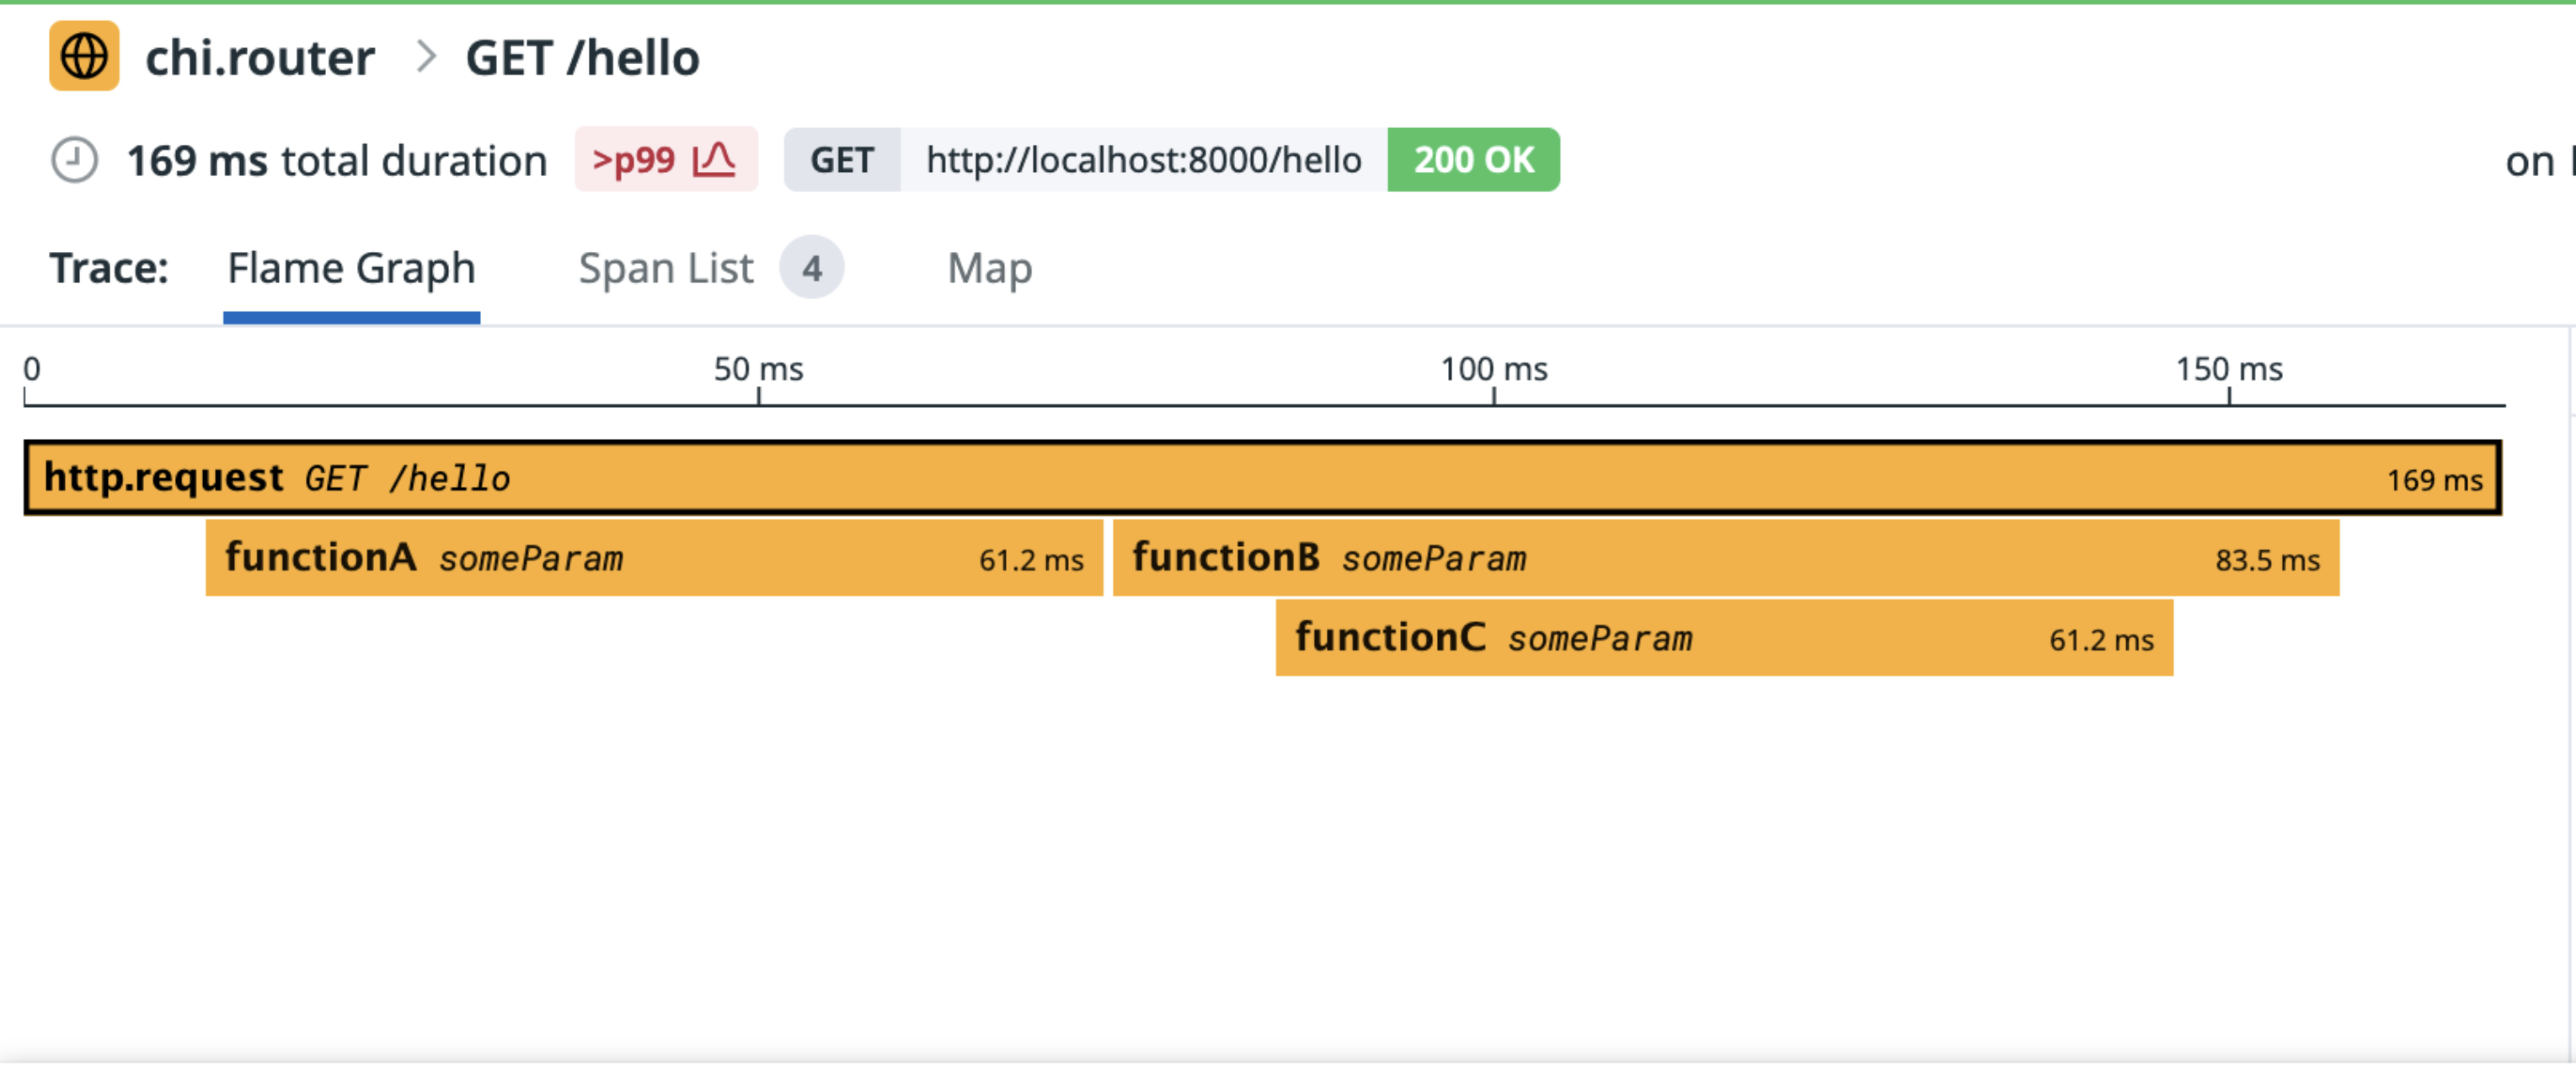
You can see that r.Context is passed twice, then it passes again under functionB() to functionC(). This kind of context-passing will build a flamegraph like this:
Database performance
Tracing the database query performance is done by wrapping the database driver like this,
        sqltrace "gopkg.in/DataDog/dd-trace-go.v1/contrib/database/sql"
...
        sqltrace.Register("pq", &pq.Driver{}, sqltrace.WithServiceName("postgres"))
        db, err := sqltrace.Open("postgres", args)
        if err != nil {
                panic(err.Error())
        }
Then instead of executing a query like this,
db.Query(statement)
Now you have to append Context to the function name and pass the context.Context object.
db.QueryContext(ctx, statement)
Also applied to other database functions (QueryRow() to QueryRowContext(), Exec() to ExecContext() and so on)
Distributed Tracing
Distributed tracing will provide inter-service flamegraph so you can inspect your services performance end to end through several services. To do this, you have to pass the context by using wrapped HTTP client and propagated context. Please take a look at this code of, let’s say, serviceA:
        httptrace "gopkg.in/DataDog/dd-trace-go.v1/contrib/net/http"
  ...
        httpClient = httptrace.WrapClient(&http.Client{})
        req, _ := http.NewRequest("GET", "http://service-b/hello", nil)
        req = req.WithContext(ctx)
        carrier := opentracing.HTTPHeadersCarrier(req.Header)
        _ = tracer.Inject(span.Context(), carrier)
        httpClient.Do(req)
Then the HTTP handler in serviceB,
func hello(w http.ResponseWriter, r *http.Request) {
        // Extract from propagated context
        spanCtx, err := tracer.Extract(opentracing.HTTPHeadersCarrier(r.Header))
        if err != nil {
                log.Println(err)
        }
        span := tracer.StartSpan("dummyhelloservice", tracer.ResourceName("/hello"), tracer.ChildOf(spanCtx))
        defer span.Finish()

        log.Printf("CONTEXT %+v", span.Context())
        w.Write([]byte("Hello World\n"))
}
This inter-service propagated context passing will let Datadog build flamegraph like this:
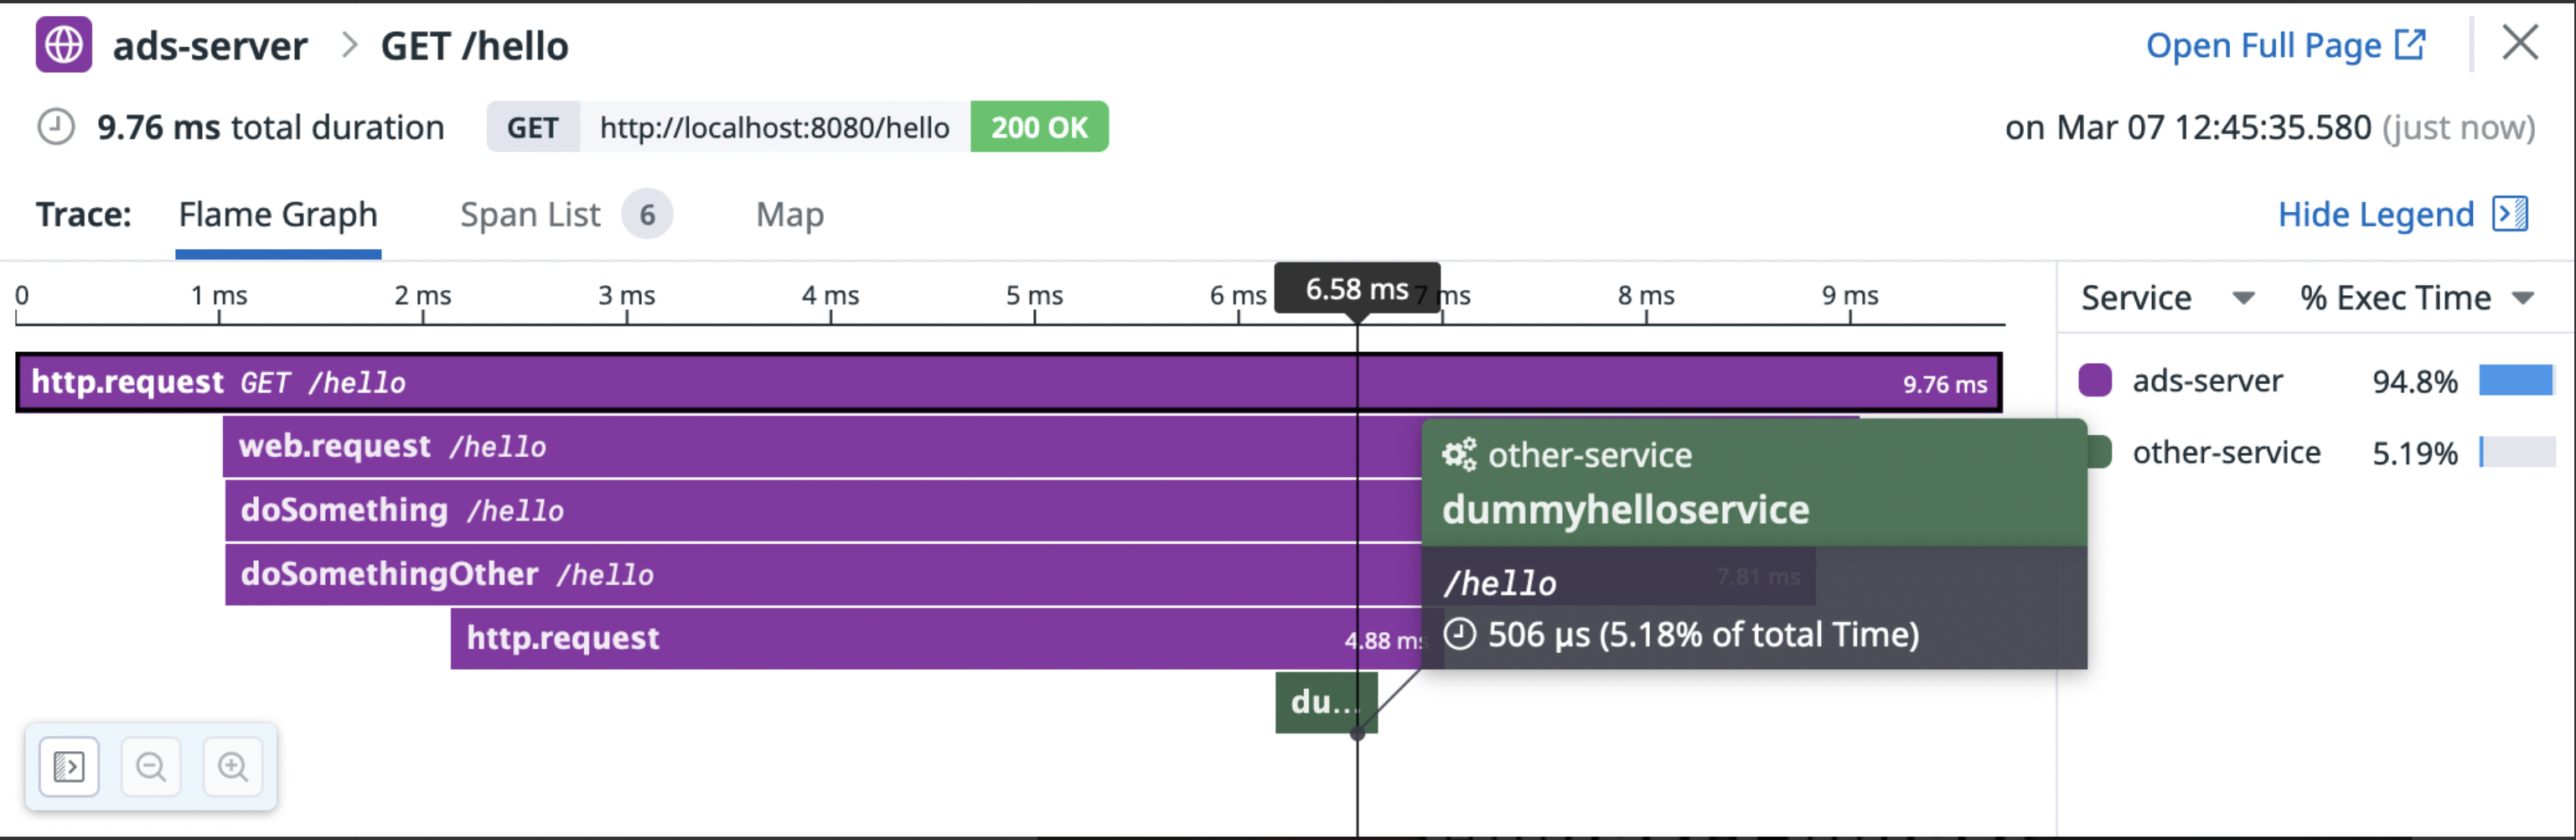
If there is something sit between the services (e.g. a proxy or gateway), this something must support context propagation. Some known proxy that have this feature/plugin/extension are Nginx and EnvoyProxy.
Impact to the codebase

You have to get used to using context.Context and always consider each time you write a function, whether you want to trace the performance or not.
For system-wide implementation and to minimize the refactor effort, you can use helper like this,
/*
 * To get current function name from a function,
 * heavily used by ddtrace implementation.
 * Usage:
 *
 *     pc, _, _, _ := runtime.Caller(0)
 *     log.Println(utils.GetFunctionName(pc))
 */
func GetFunctionName(pc uintptr) string {
        splitted := strings.Split(runtime.FuncForPC(pc).Name(), ".")
        functionName := splitted[len(splitted)-1]
        return functionName
}
Then put these lines at the start of any functions that you want to trace,
func SomeFunction(ctx context.Context, foo string) error {
        pc, _, _, _ := runtime.Caller(0)
        span, ctx := tracer.StartSpanFromContext(
                ctx,
                utils.GetFunctionName(pc),
                tracer.ResourceName("someParam"),
        )
        defer span.Finish()
...
Please remember to pass the context.Context as you need. Losing the context means losing the correct flamegraph representation.
>> Home