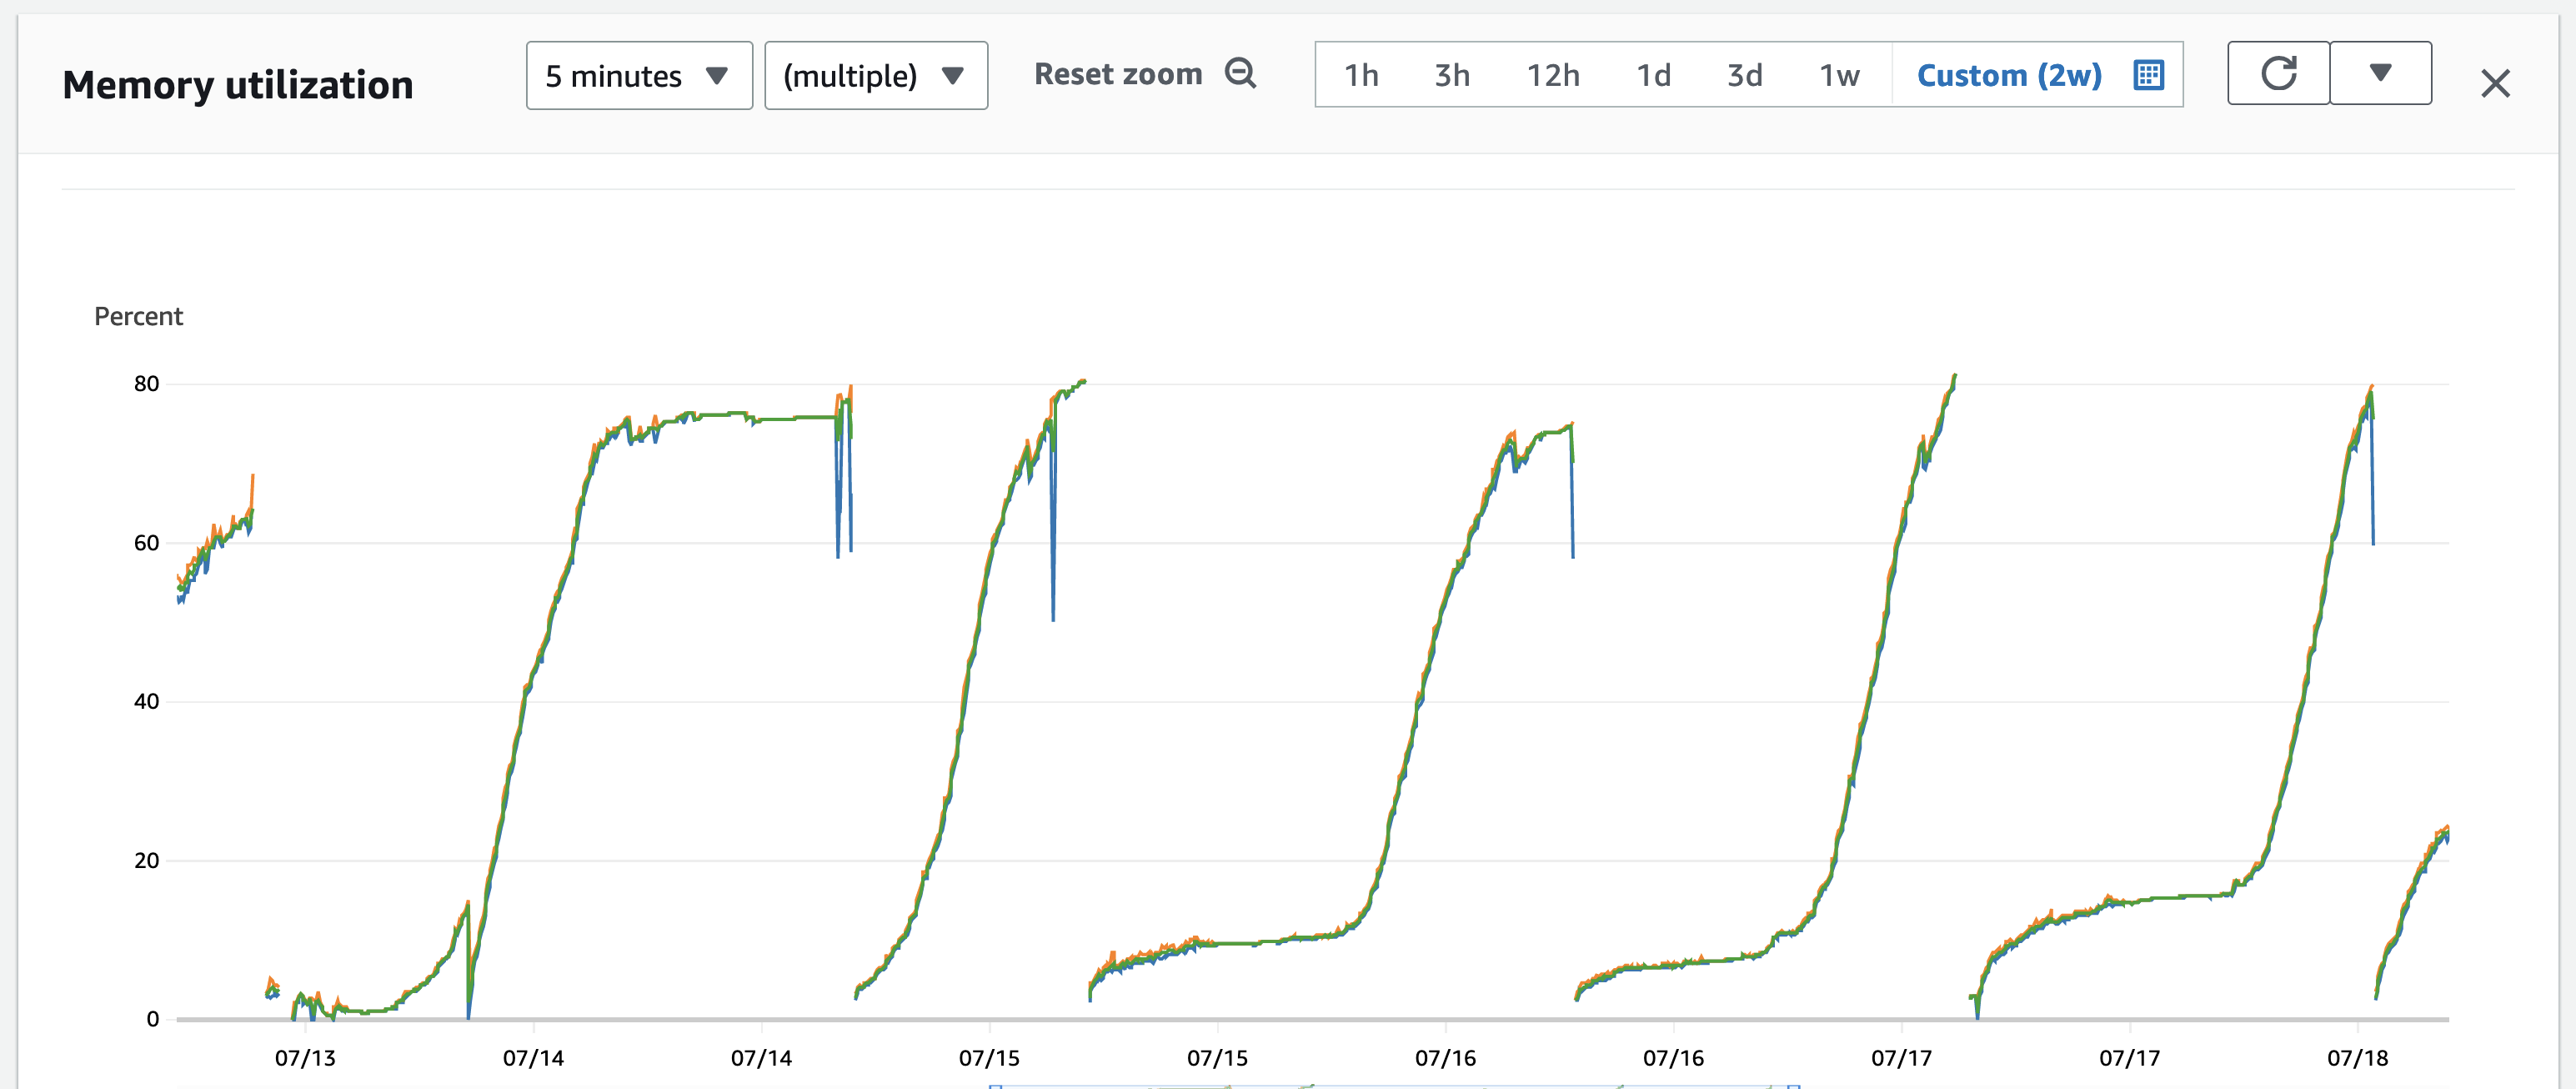
So I encountered with a service that has to be restarted in every few hours or so because their memory consumption trajectory is like SpaceX’s Falcon 9 being launched toward ISS.
Hmm. Golang is garbage collector language, so we just need to add *.Close() to every opened thing, right?
Turn out it is not always the case.
The characteristics of the service
The main purpose of this service is to upload files. Almost ten thousand files uploaded in a day or about 15GB/day. Total files uploaded up until I write this post is about 14,56TB. The service was hosted in AWS ECS. They said each restart takes up to 15 minutes and when it happened, complaints bombardment coming from their users. At some points, they have to upgrade the instance to the one with bigger RAM just to buy more time before the system crashed again.

This is indeed an interesting problem.
pprof
Golang has pprof, a powerfull tool for profiling resource consumption. Its implementations are available in popular frameworks like chi or gin. This is a super easy example of how to implement pprof for a gin engine by using github.com/gin-contrib/pprof package:
import (
	...
	"github.com/gin-contrib/pprof"
	...
)

...

	isProfilingEnabled, _ := strconv.ParseBool(os.Getenv("PPROF"))
	if isProfilingEnabled {
		pprof.Register(engine)
	}
This will open some endpoints in the service for debug purpose under /debug/*. Since this case is about memory allocation, I’ll focus on allocs.
I immediately planted pprof, fetched the state dump of the service then display it locally by using this command
go tool pprof -http=":8080" http://foobar/debug/pprof/allocs
It’ll open web browser to show you the data.
ParseMultipartForm
Since the service is mainly about uploading files, I proceed to reproduce prod-like situation by spinning up a local instance, bypassing the authentication then start to upload file (1.3MB, repeated 100x).
#!/bin/sh
i=0
while [ $i -ne 100 ]
do
	i=$(($i+1))
	curl --location 'http://localhost:8000/upload' \
	--header 'Authorization: Bearer TOKEN' \
	--form 'file=@"/Users/herpiko/Downloads/foo.txt"'
done
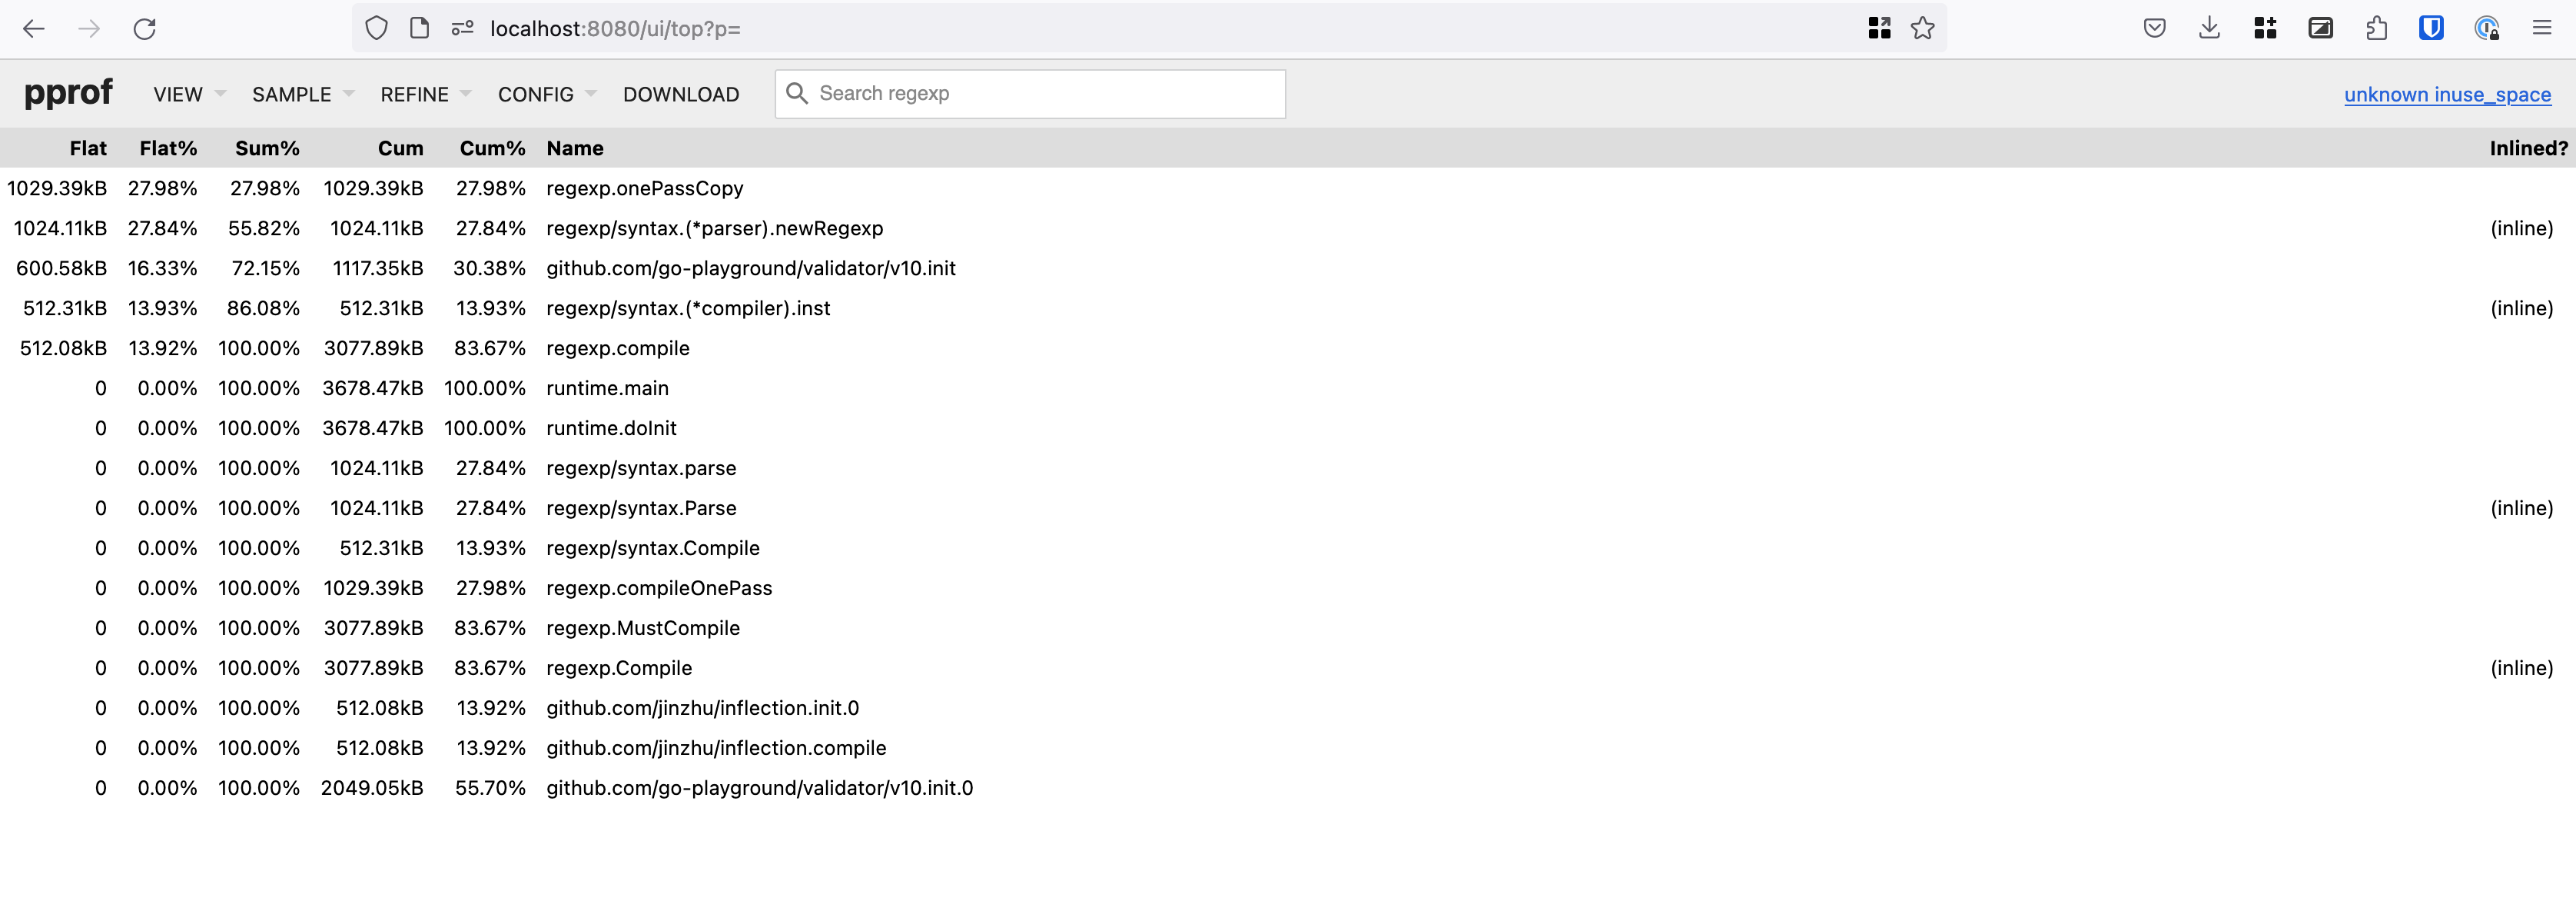
Let’s see the pprof reports.
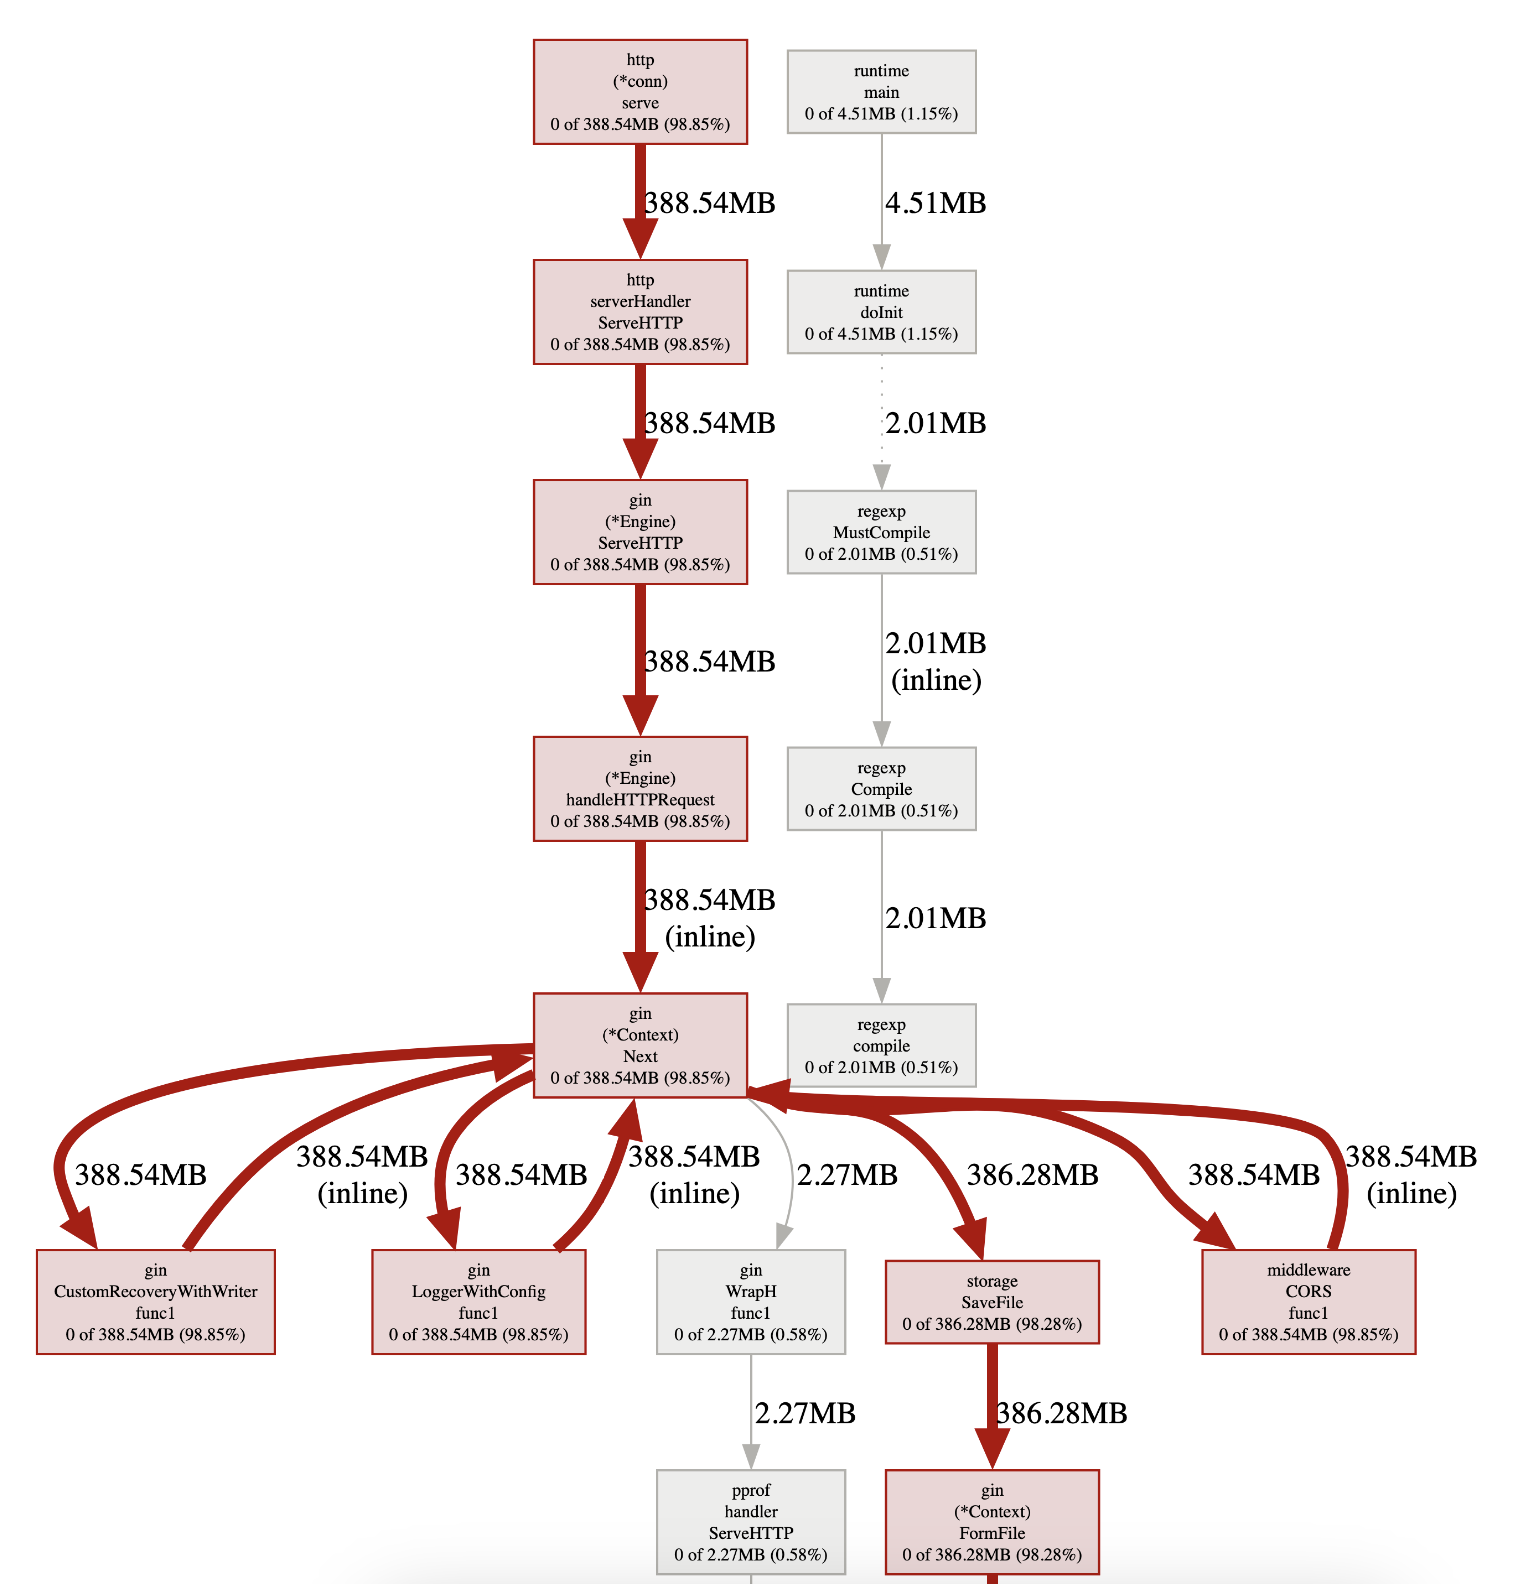
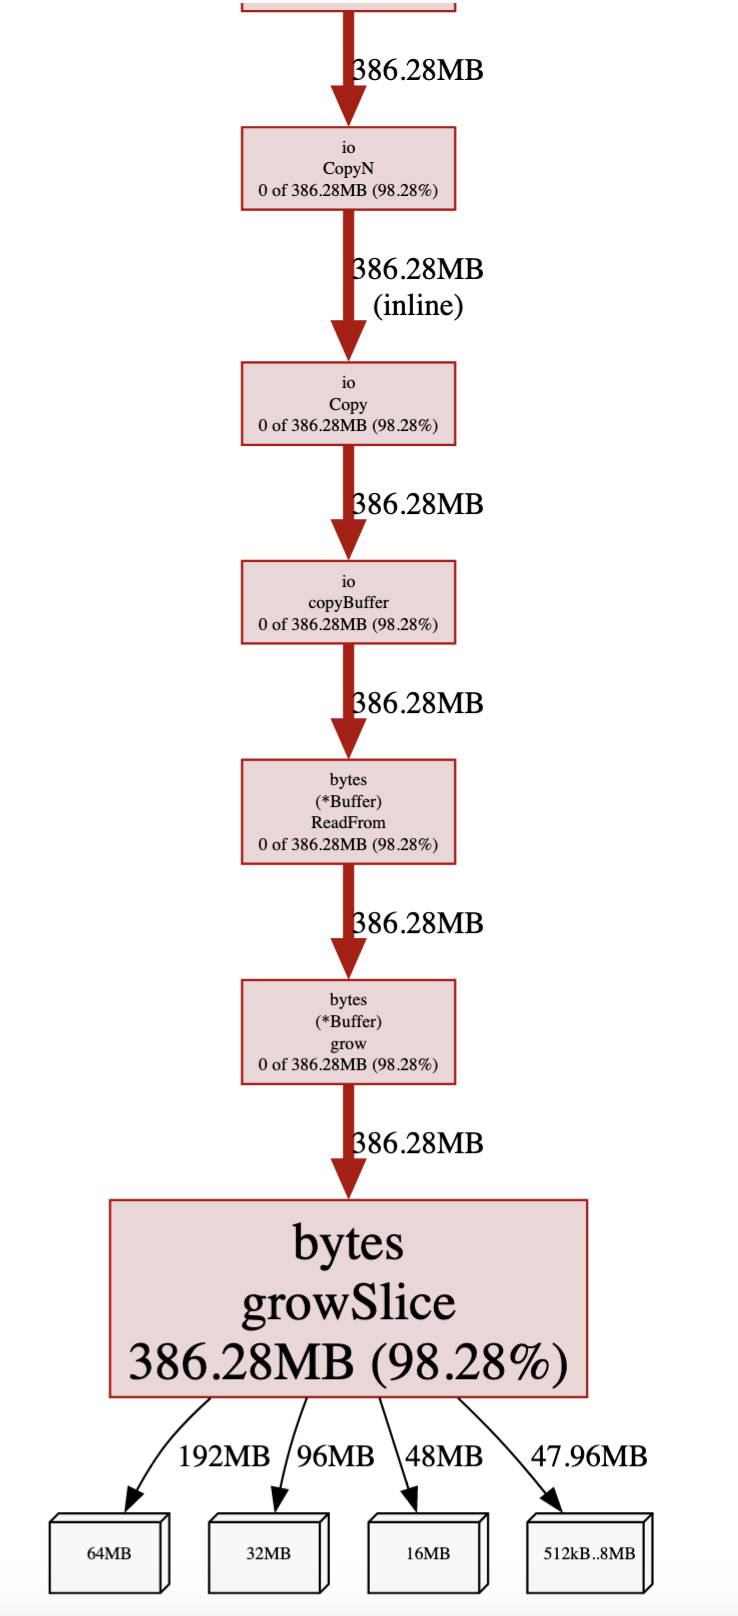
pprof was showing that 386MB are consumed. What are those? Let’s see FormFile documentation.
FormFile returns the first file for the provided form key. FormFile calls ParseMultipartForm and ParseForm if necessary.
And then the ParseMultipartForm,
ParseMultipartForm parses a request body as multipart/form-data. The whole request body is parsed and up to a total of maxMemory bytes of its file parts are stored in memory, with the remainder stored on disk in temporary files. ParseMultipartForm calls ParseForm if necessary. If ParseForm returns an error, ParseMultipartForm returns it but also continues parsing the request body. After one call to ParseMultipartForm, subsequent calls have no effect.
So if the file size is bigger than the maxMemory, the rest of it will be saved to disk as temporary files. The problem is the one that is in memory is not cleared by GC after sometimes. Even running interval GC in a goroutine does not help. Honestly I still don’t know how to clear this up in elegant way but what if we put zero as ParseMUltipartForm() param? So nothing will be allocated in memory, all uploaded files go straight to filesystem/disk. Fortunately gin is exposing the Request instance, so we could tweak this easily.
Because I don’t want to messing up with this system, I am using Growthbook’s feature flag to control the value. If something goes wrong after the deployment, I could revert the value back to 32MB.
	parseMultiForm := gb.Feature("request-parse-multipart-form").GetValueWithDefault(32.0).(float64)
	c.Request.ParseMultipartForm(int64(parseMultiForm) << 20)
	defer c.Request.MultipartForm.RemoveAll()
Consideration in this case:
- The instance should have more than 15GB free disk space to accommodate this, just in case.
- Use
defer c.Request.MultipartForm.RemoveAll()to make sure the temporary files get removed we go out of scope. - Compare the latency. In my case, the upload performance is only 10% slower than by using default
maxMemoryvalue (32MB), which is okay. - Monitor the disk pressure after the deployment
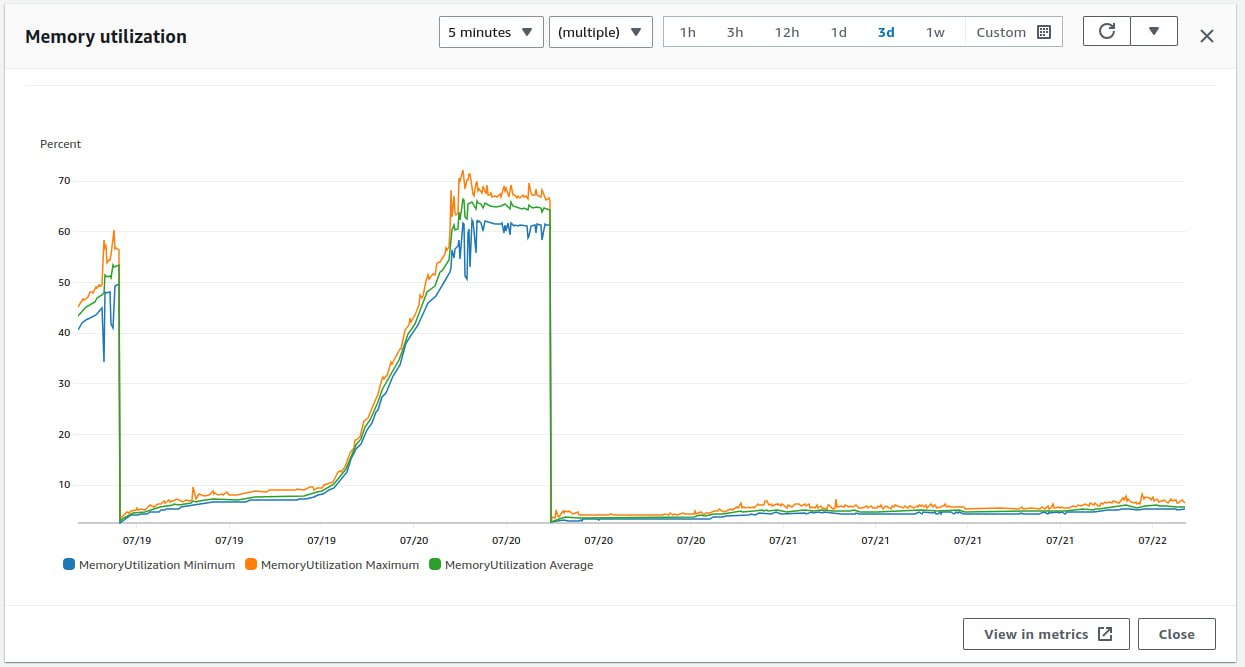
After it got deployed, we monitored it and found that the memory consumption trajectory declined to 12 degrees.
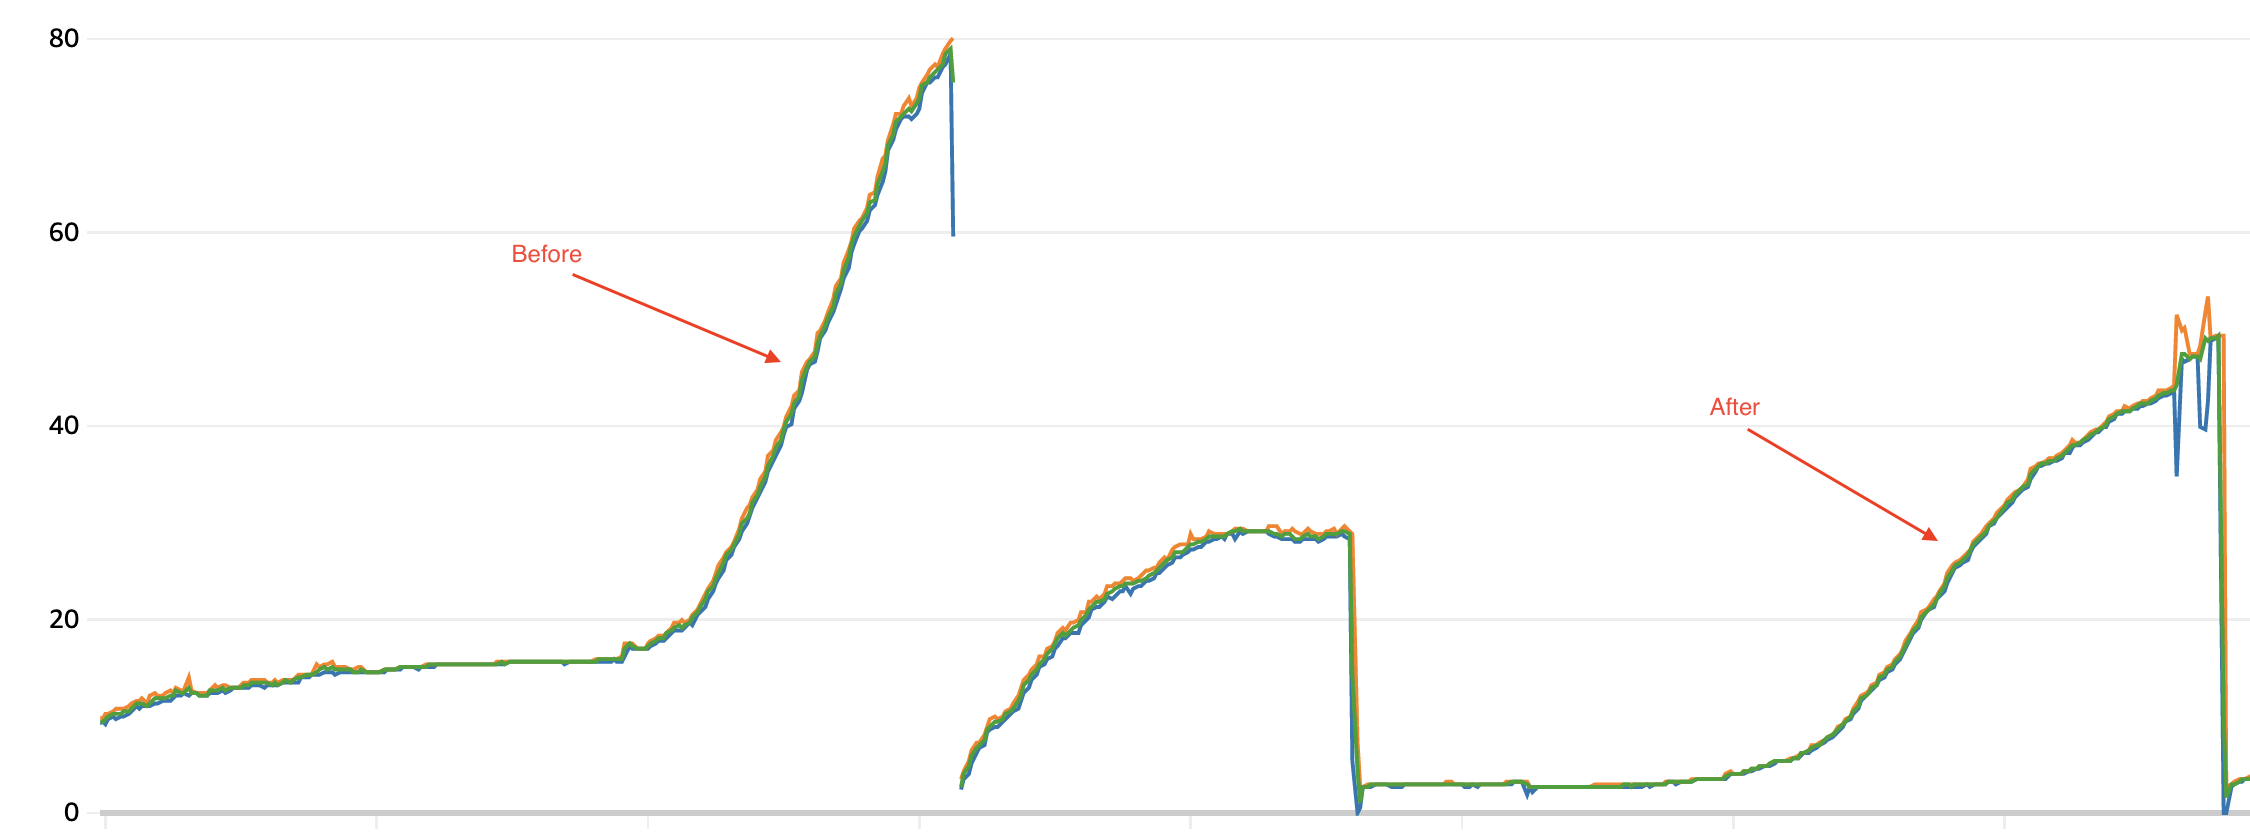
It improved but still did not meet my expectations. At least no need to restart the system in the middle of peak hours, it bought us some little time.
So what else is left in the memory? We turned on the pprof in production. Is it okay to do performance profiling in production? Absolutely yes.
Kafka Writer
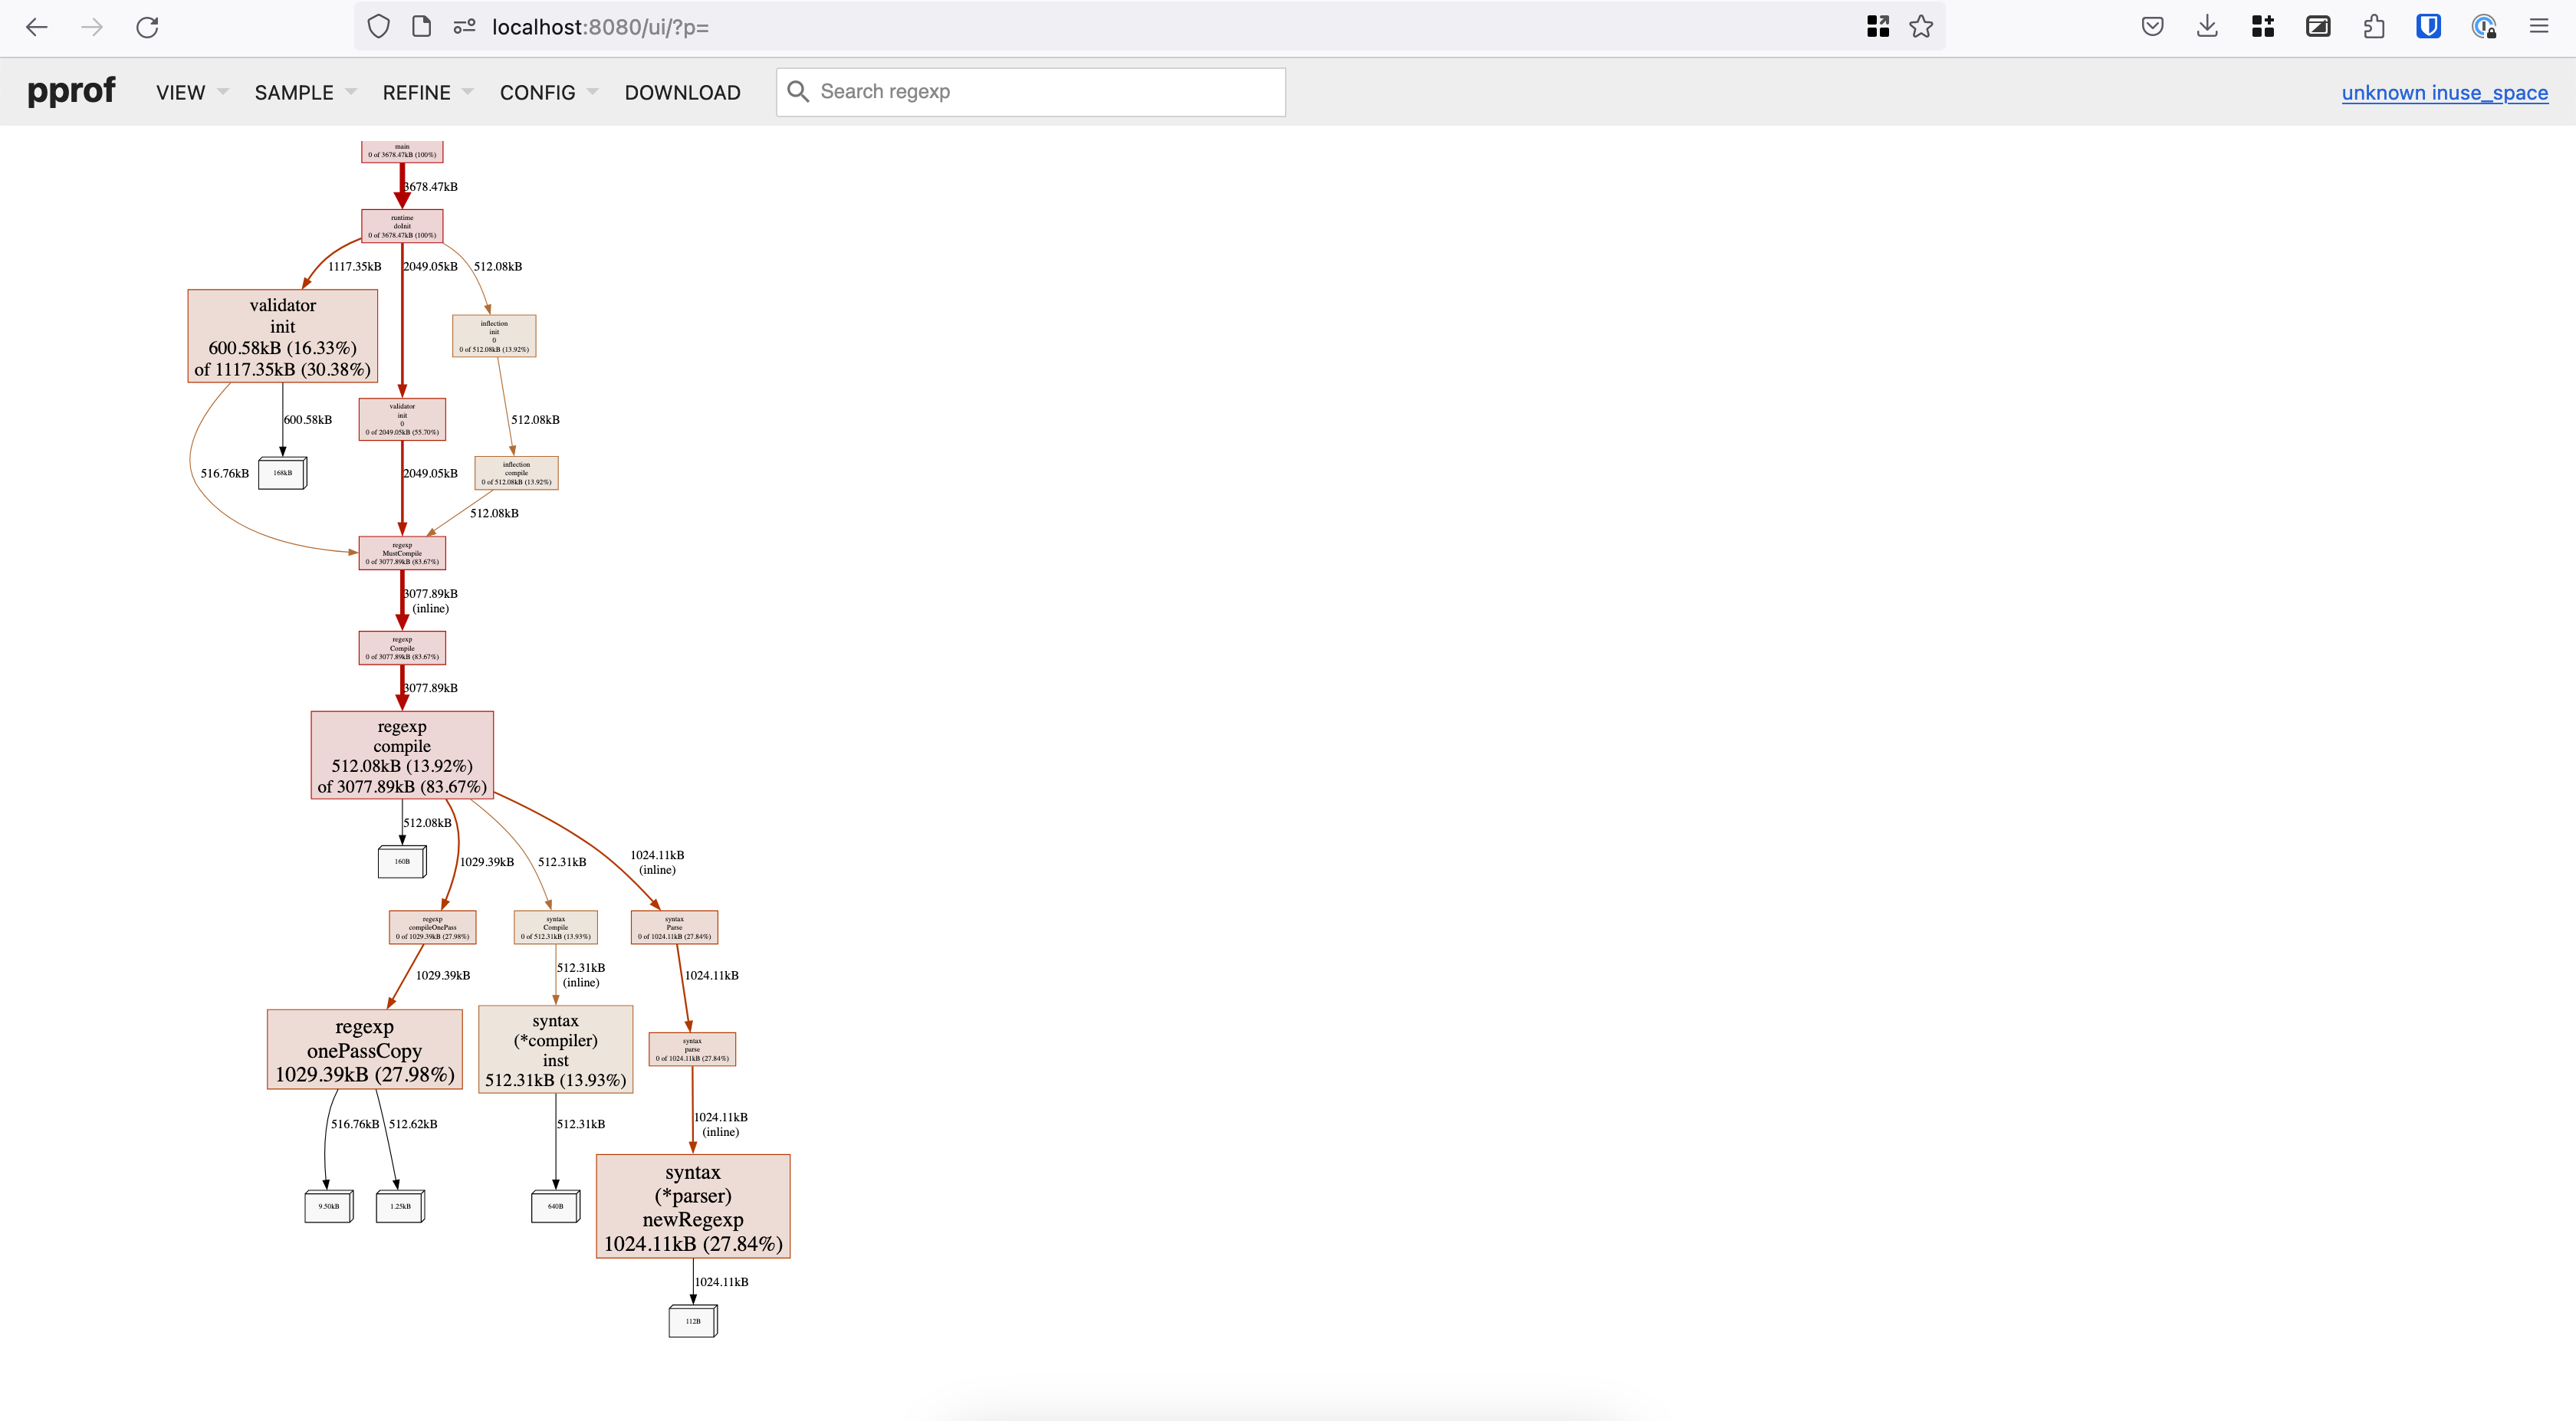
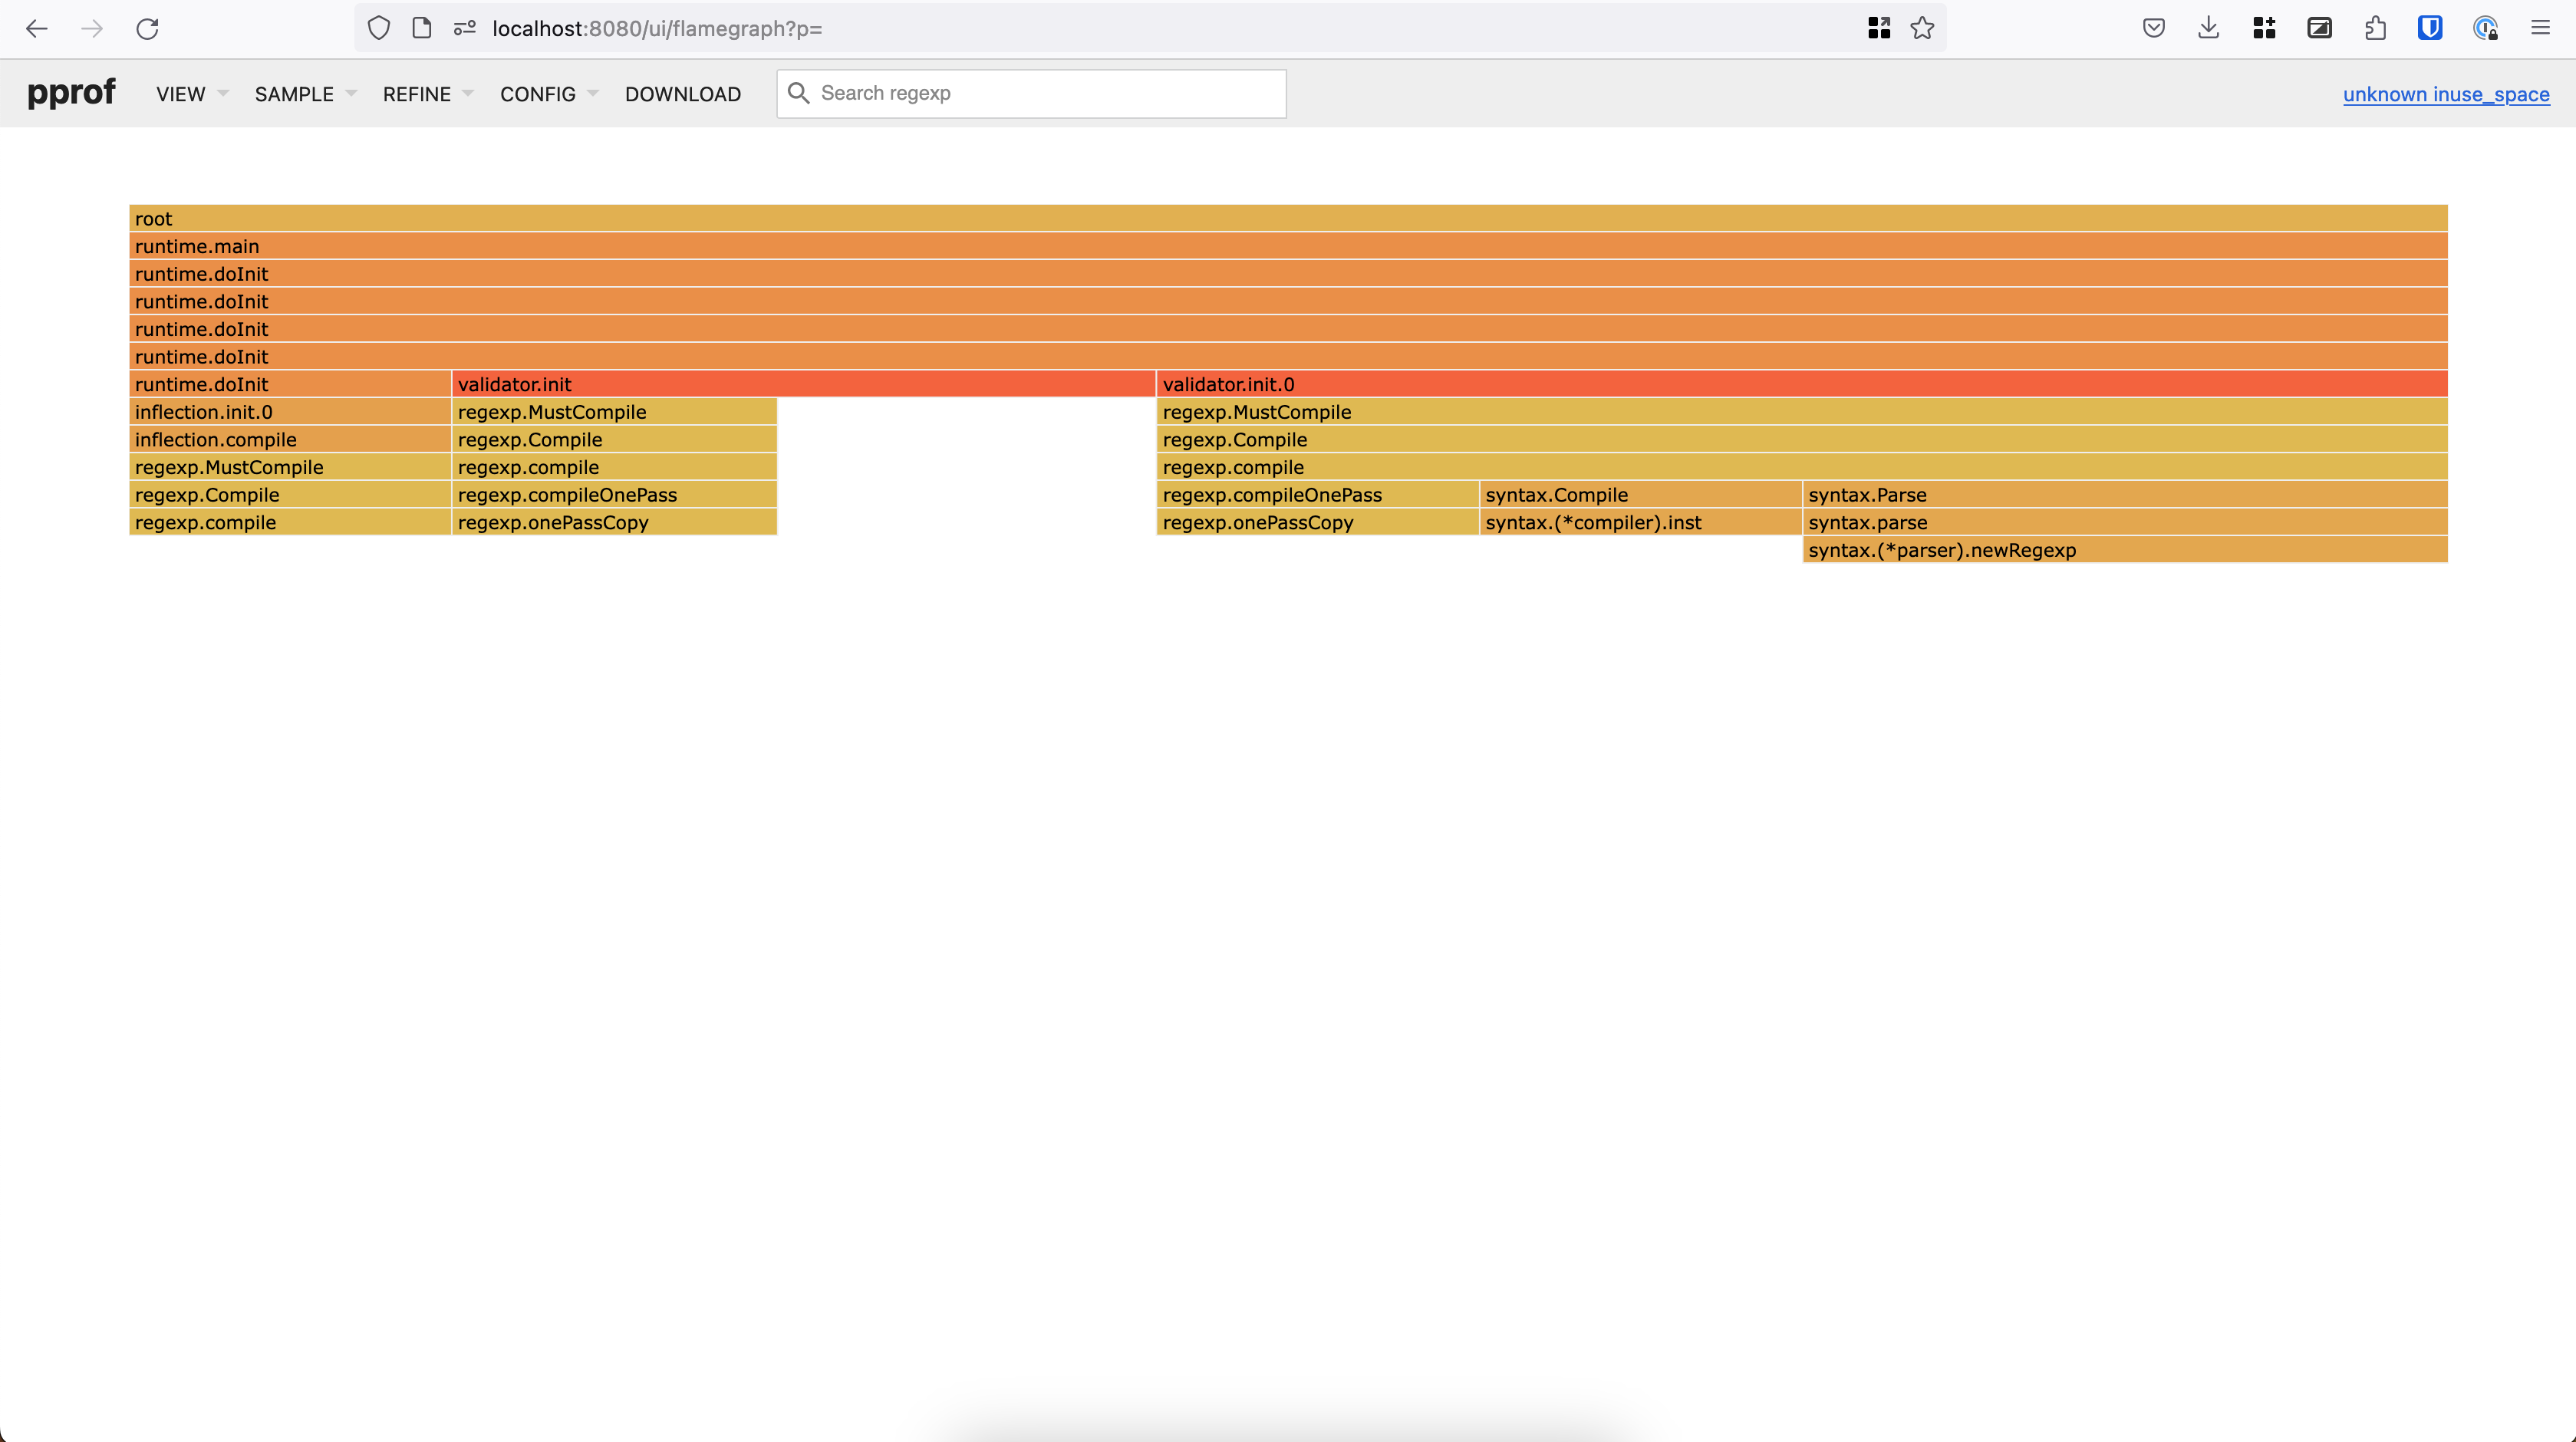
This child-nodes graph showed up under Kafka related nodes.
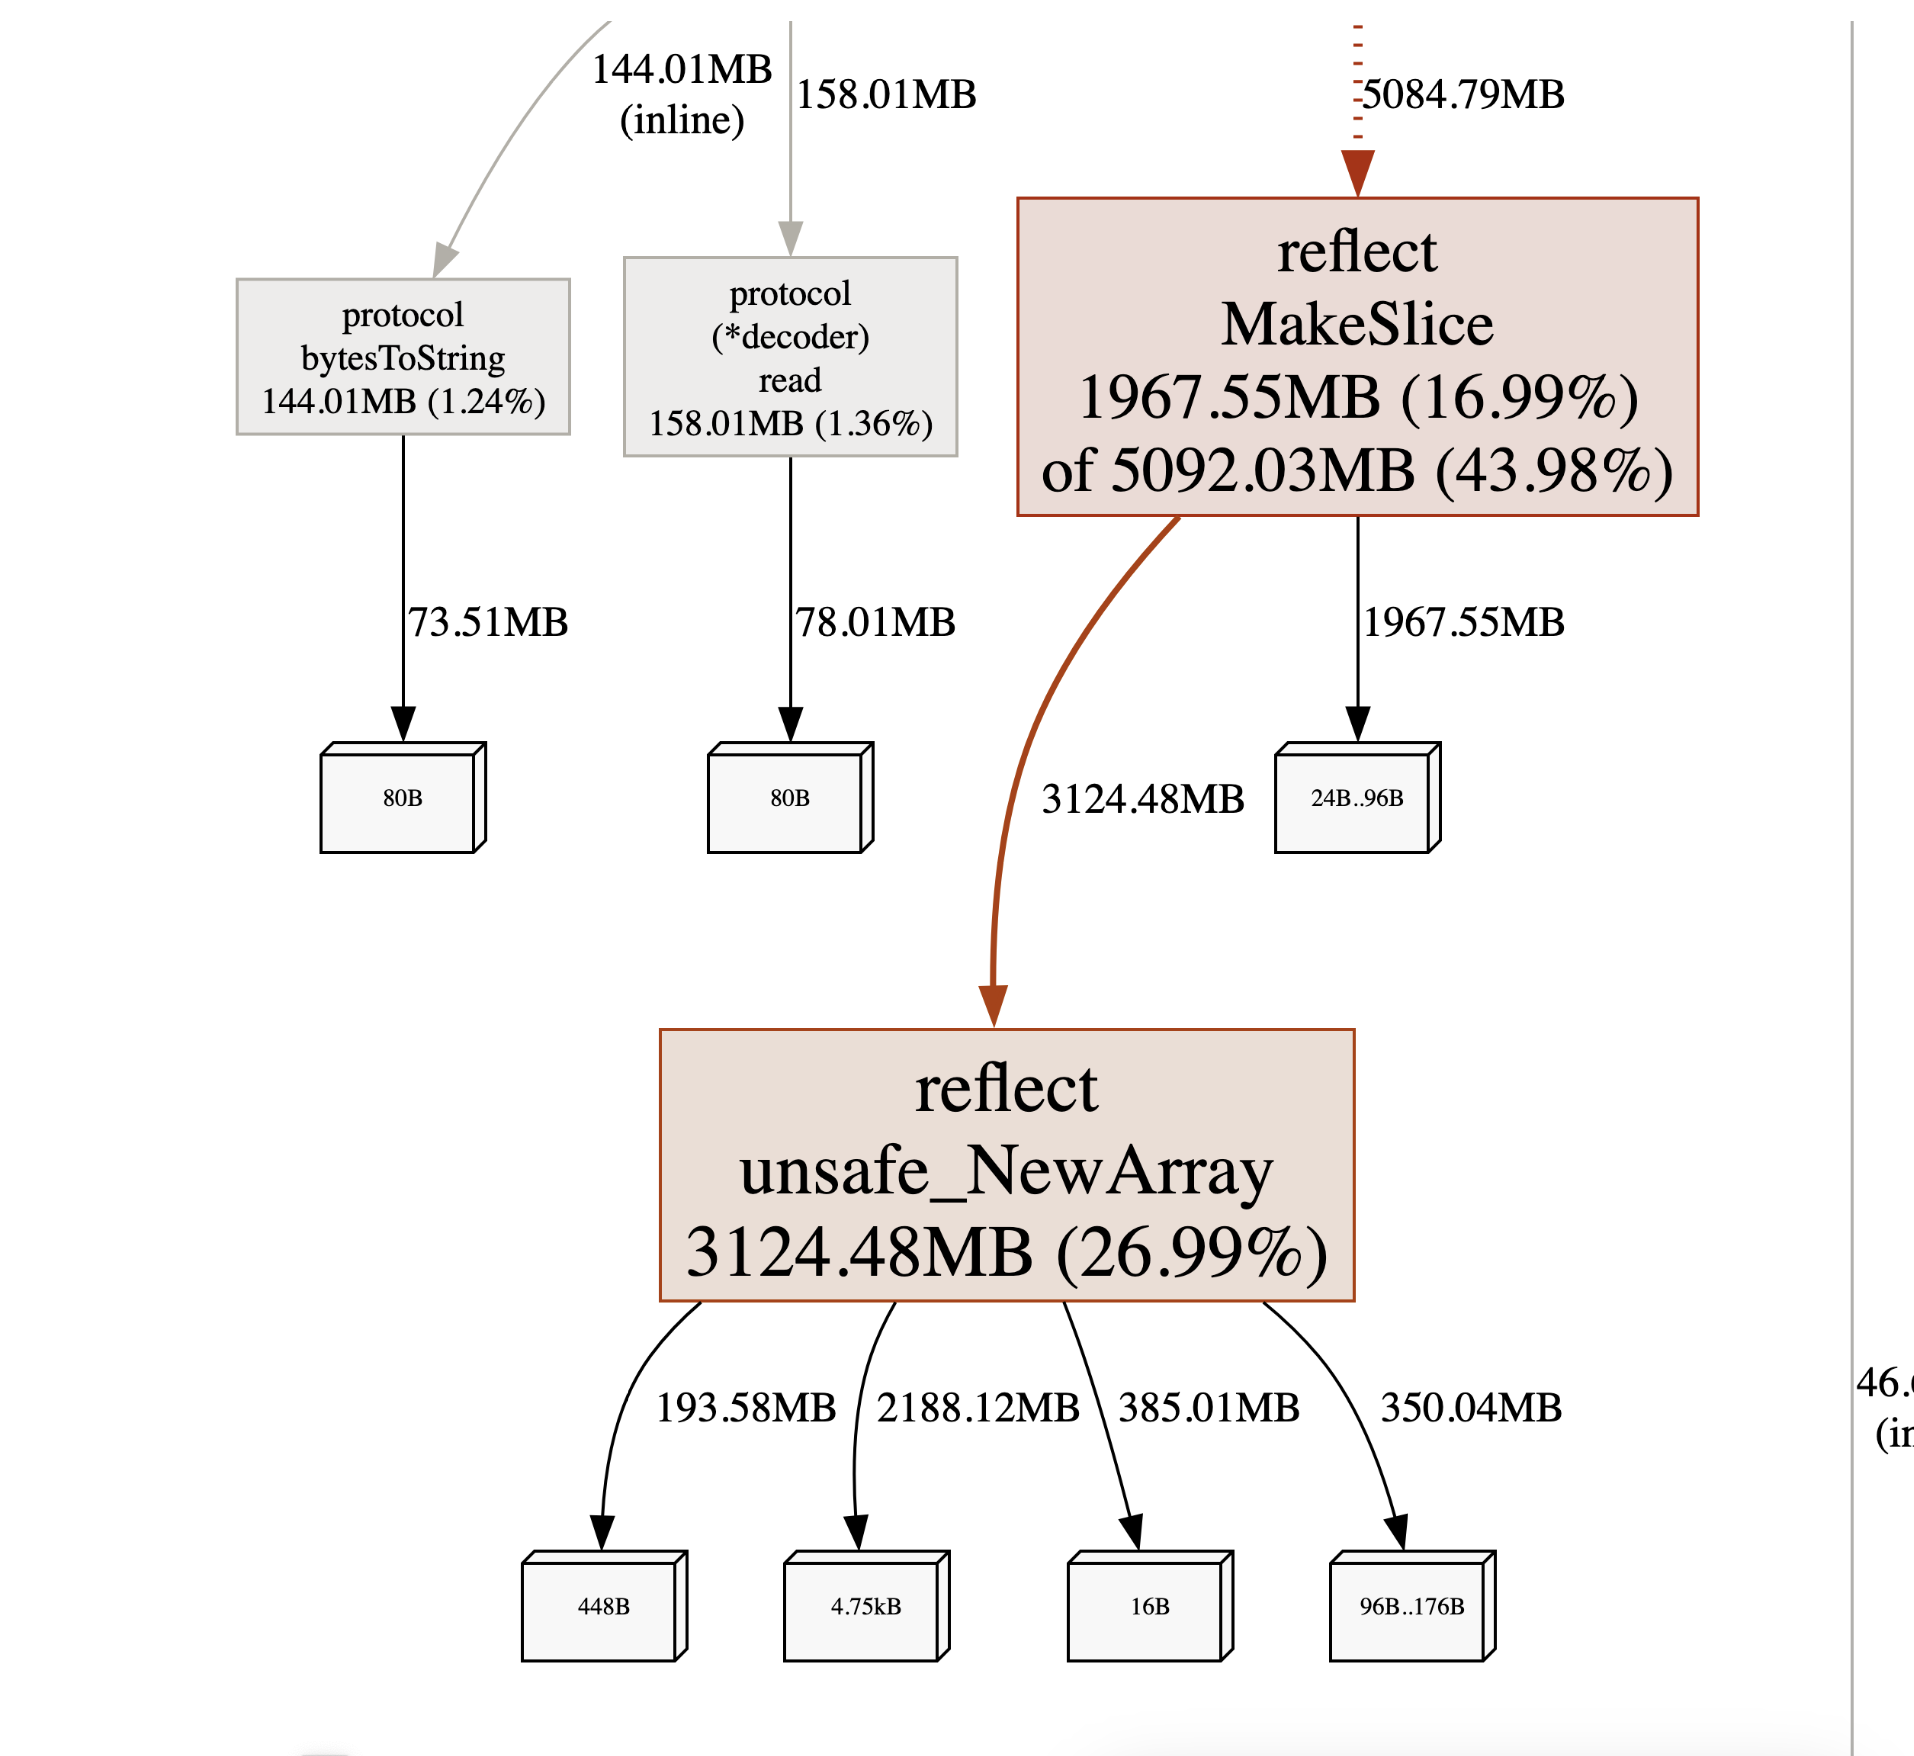
Before this, I just skimmed the codebase and focused on uploading-related stuff. I don’t know if this service is involving Kafka.
Let me repeat this question.
Golang is garbage collector language, so we just need to add
*.Close()to every opened things, right?
At this time, you are right. For every Kafka writer that initiated, there was no Close() being called. Let’s fix this.
writer := kafka.NewWriter(kafka.WriterConfig{
	Brokers:  messagebroker.Brokers,
	Balancer: &kafka.Hash{},
	Dialer:   messagebroker.Dialer,
	Topic:    "statusNew",
})
defer writer.Close() // This is missing
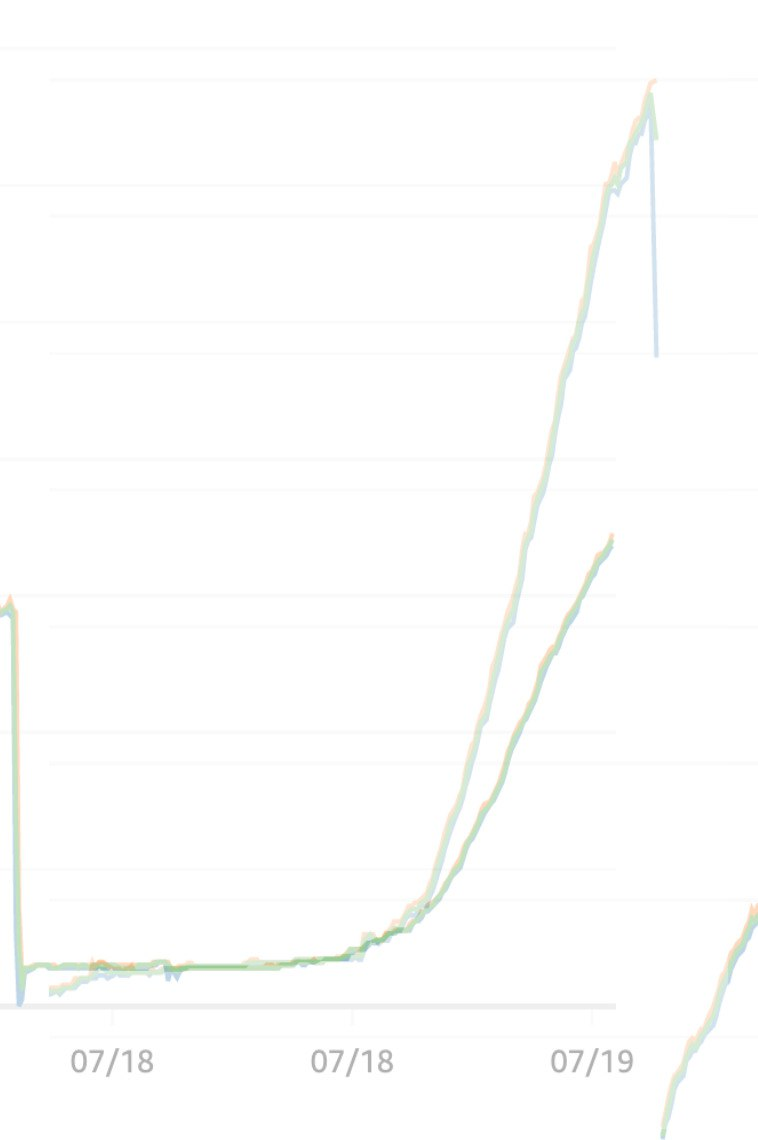
Pushed this to production then memory consumption got flattened near zero.
As Lieutenant General Leslie Richard Groves Jr said,

>> Home