Authors: Adnan Isnain N, Phill Imanius Winoto, Herpiko Dwi Aguno
RTB (Real-Time Bidding) is a technology used in programmatic advertising that lets advertisers bid on and purchase ad impressions in real-time as they become available. This allows advertisers to target their ads to specific audiences and adjust their bids based on the value of those impressions.
After diving into the OpenRTB specification and reviewing the technical documentation from one of the ad exchanges we wanted to integrate with, we thought we were ready for the challenge.
It requires that the total latency be within 100 milliseconds, including connection establishment and bid response. If either of these independent thresholds are exceeded (connection and bid response time) during the transaction the bid is considered a ’timeout'.
Then, we learned the traffic we’d be dealing with in the RTB environment would range from 10,000 RPS to 500,000 RPS. That’s almost 20 times the traffic of our direct supply ads network!

Background
When a bid request hits our system, we have to run through a lot before we can even bid: eligibility checks, pacing, filtering, budget management, targeting, optimization, experiments, pricing strategy, and more. All of these processes require data from our PostgreSQL database and Redis. From our experience with our exclusive direct supply ads network, we knew that handling 500 RPS could take around 200-400ms. That was “okay-ish” in our previous setup, but it’s definitely not okay in the RTB world. We weren’t sure if our existing processing pipeline could handle 10,000 RPS. Oh, and hello, PostgreSQL replication lags!
Here’s what we did to tackle the problem:
Observability
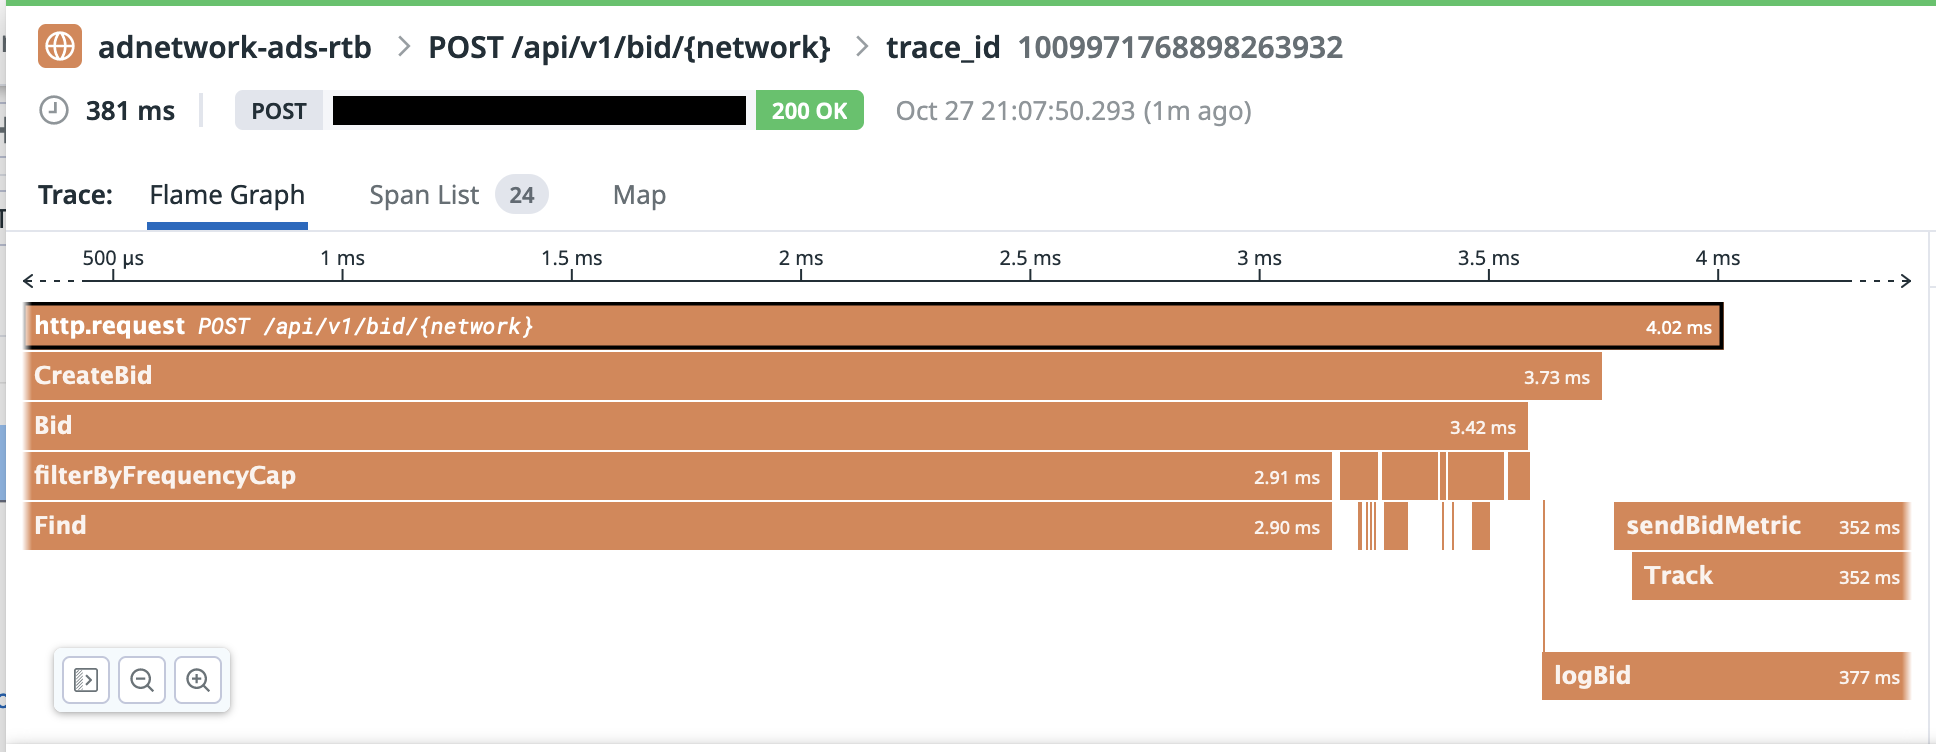
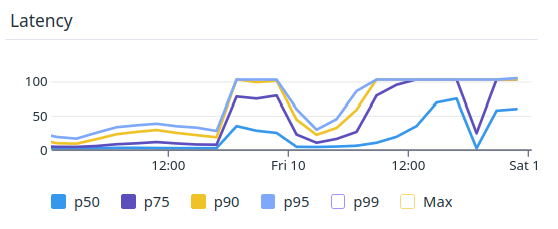
We implemented APM (Application Performance Monitoring) early and integrated it into our messaging platform, allowing us to closely monitor performance dynamics. The screenshot below shows our ad pipeline in action, helping us track how much latency each function introduces. Once a latency threshold is reached, we can immediately pinpoint the bottleneck and address it.
Tying this observability into alerting is essential, so we can quickly focus on fixing the right issues when they arise.
Stress load design
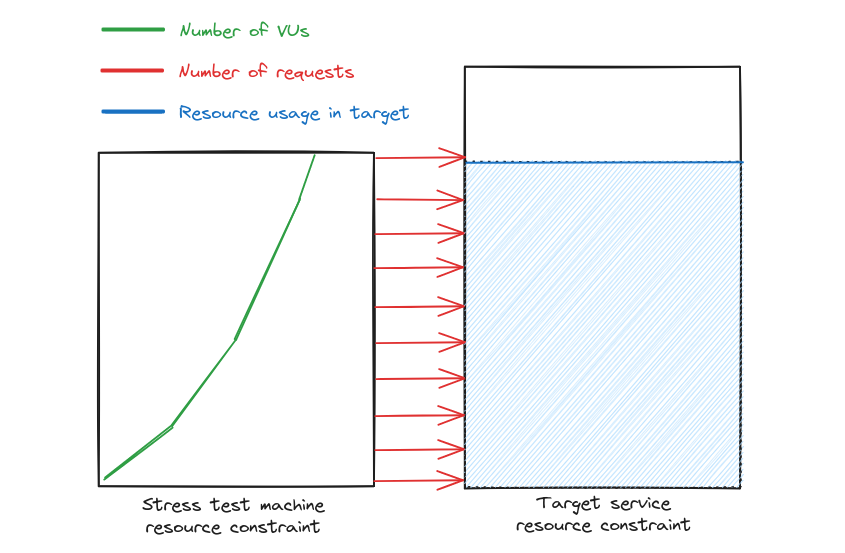
We then moved forward with designing and building a stress load testing framework, leveraging Grafana’s K6. To simulate 10k RPS, and even double it to 20k if bid callback URLs were included in the simulation, we needed a robust machine capable of allocating enough Virtual Users (VUs) to handle that kind of load.
Instead of paying for an idle, overpowered machine, we started small, with modest machines and low RPS, scaling up as needed. To streamline this process, we created a simple framework that allowed anyone on the team to run a stress load test directly from the CLI. You could specify K6 parameters, our bid rate setup, and even the machine spec—ranging from a t3.small to a c5.xlarge.
This CLI command triggers a job that spins up an AWS EC2 instance with the selected machine type, runs the test, grabs the results, and shuts the machine down as soon as the test is complete.
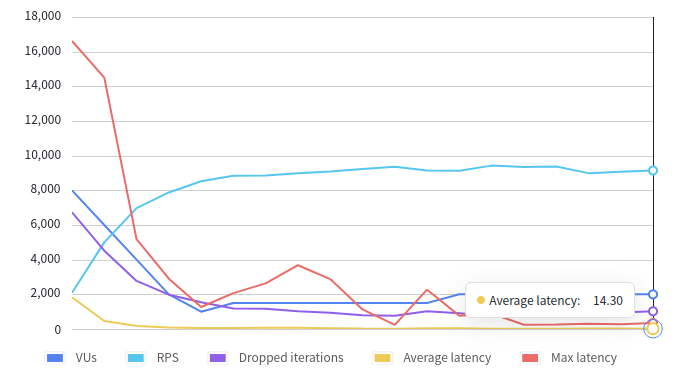
So far, we’ve run 503 stress load tests against the bidder service. Our best result? 9,141 RPS with latency results that still leave us plenty of room before hitting the 100ms limit.
- Average: 14.3ms
- Max: 343.09m
- p90: 37.25ms
- p95: 51.54ms
We still have plenty of room for additional features before it reaches the 100ms limit.
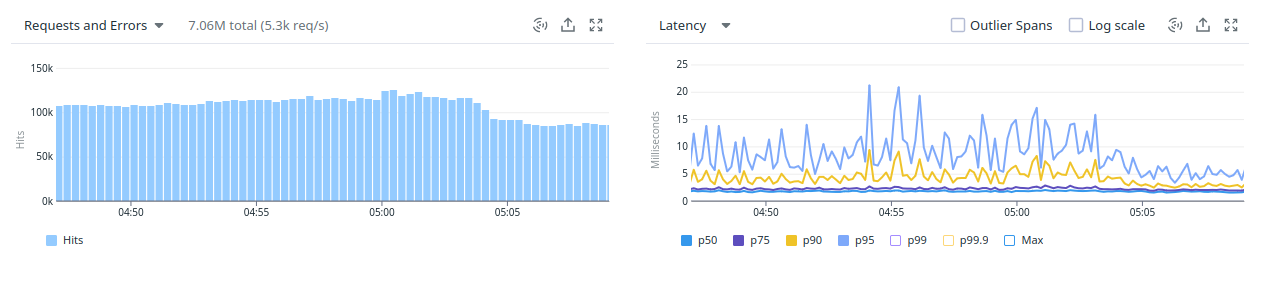
Having this tool in place has been a game-changer. It helps us fine-tune resource configurations and monitor automatic scaling.
In-Memory Indexing Everywhere
This approach turned out to be the first and most important trick we pulled off. By carefully designing the data model around the OpenRTB spec, we made sure the system wouldn’t have to touch any database or storage during bid processing. Everything we need is loaded into memory, structured like indexed records in a database. When we need something, we just pull it by its key. Some of these keys are even designed like trees, which allows for flexible and in-depth queries when necessary.
To make sure our PostgreSQL database reflected to this memory model, we maintain a dedicated go routine to sync them in interval basis. Fortunately, this sync process does not have to be real-time. A few minutes gap is fine.

This in-memory approach might seem like a trick, but it’s actually a pretty common practice. I even heard a funny story from another company where engineers were asked what they’d do if there were too many objects to store in memory. They just shrugged and said, “As long as it fits in memory, we’re good.”
Benchmark everything and use the best that is available
Sometimes, it catches us by surprise that latency happens not because of our logic or processing, but because of the libraries that we use. In our case, Golang’s standard library for JSON encoding/decoding is not that good. We ended up using alternatives for various cases.
- JSON encoding/decoding: json-iterator/go
- Map: haxmap
- Cryptographic signature: ED25519
In RTB, milliseconds matter. Small optimizations across the stack can make a huge difference, and sometimes, you need to go beyond default tools to hit your targets.
But what happens when you benchmark all the available options and the “best” still doesn’t meet your performance standards? That’s exactly what happened when we started using Redis.
Special Purpose Storage, a database with FPGA in mind
This special-purpose storage is essentially an API service powered by haxmap for fast read-write operations. We don’t worry about ACID principles in this case. We call it storage or a database because it operates as a single instance and scales vertically, much like a traditional database. And, just like an FPGA (a programmable integrated circuit), this database is built for specific purposes and data models.
Before this, we used Redis, but it introduced unacceptable latency on the client side, even after we tweaked it and eventually migrated to AWS ElastiCache. We replaced Redis with a simple service that used a Golang map as in-memory storage. It performed almost twice as well as Redis until we encountered issues with concurrent read-write operations. Adding a mutex solved the concurrency issue, but unfortunately, it also slowed performance drastically, by order of magnitude.
That’s where haxmap saved us—it significantly reduced latency to just a few microseconds per service. We now use this approach to store data for frequency caps and heuristic pricing.
This method does have some trade-offs, like single-instance limits and potential data availability issues. To prevent data loss, we created a Go routine that regularly backs up the map to S3 and restores it whenever a pod needs to be restarted or replaced.
The data stream
All the data coming from the bid stream is valuable to us, even the data from bids we didn’t win. But storing all of it isn’t cost-effective. To make the most out of this massive data stream, we identified two types of data:
Critical Business Metrics
This pipeline is our single source of truth from a business perspective. For this data:
- No sampling is allowed
- Data loss is not tolerable. Every single piece of data must be delivered with a 100% success rate.
- If there’s a discrepancy with other systems or sources, it must be under 2%
We carefully designed this system to ensure that any failed data transfers have a second chance to be successfully transmitted.
Bid log history
The purpose of collecting bid logs is to analyze market trends. Here, we’re more interested in the overall percentages, not exact figures. For this data:
- Sampling is fine.
- We’re okay with losing some data.
- Small lag is acceptable.
Interestingly, this bid log data is becoming one of our most valuable assets. The insights we extract from it help us understand the market better and adjust our strategies accordingly. Each new insight opens up more opportunities for growth and optimization.
Security
- ED25519 signing
Other dirty tricks
- Worker via chan
- Internal timeout
>> Home